Discussion
Multi-Criteria Analyses:
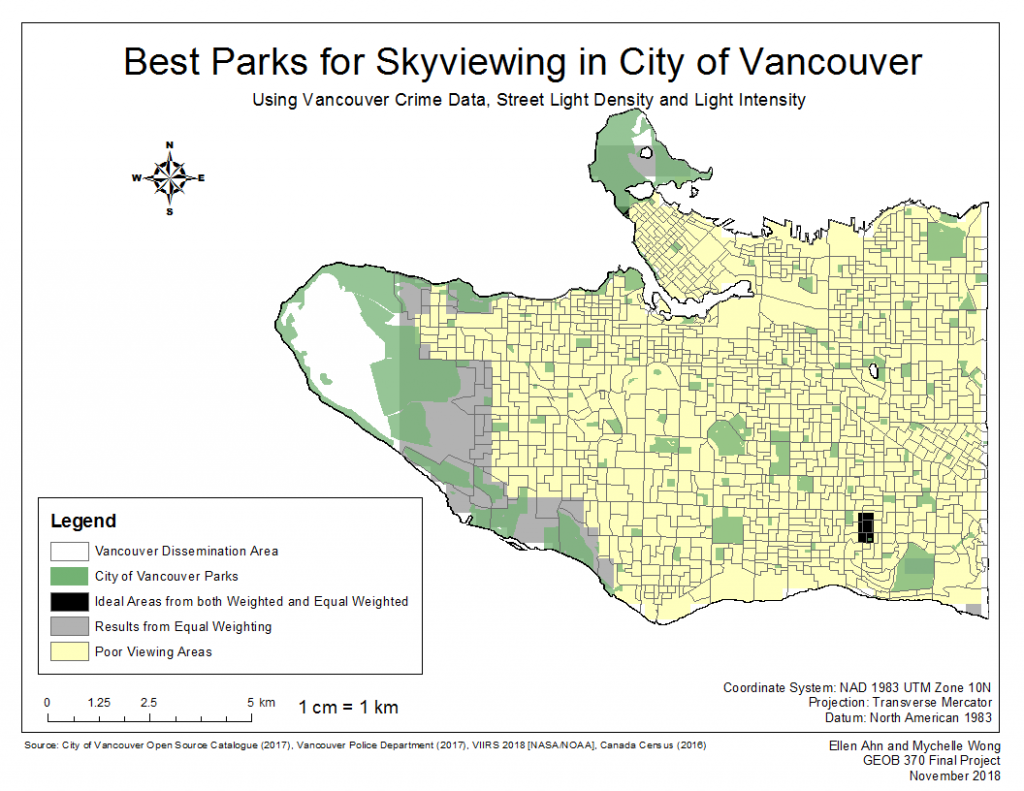
Figure 1. Results of the sensitivity analysis conducted for the crimes and street light MCE analysis. The areas that were determined as ideal sky viewing areas was conducted by combining the results of the weighted sums results with the equally weighted sums results.
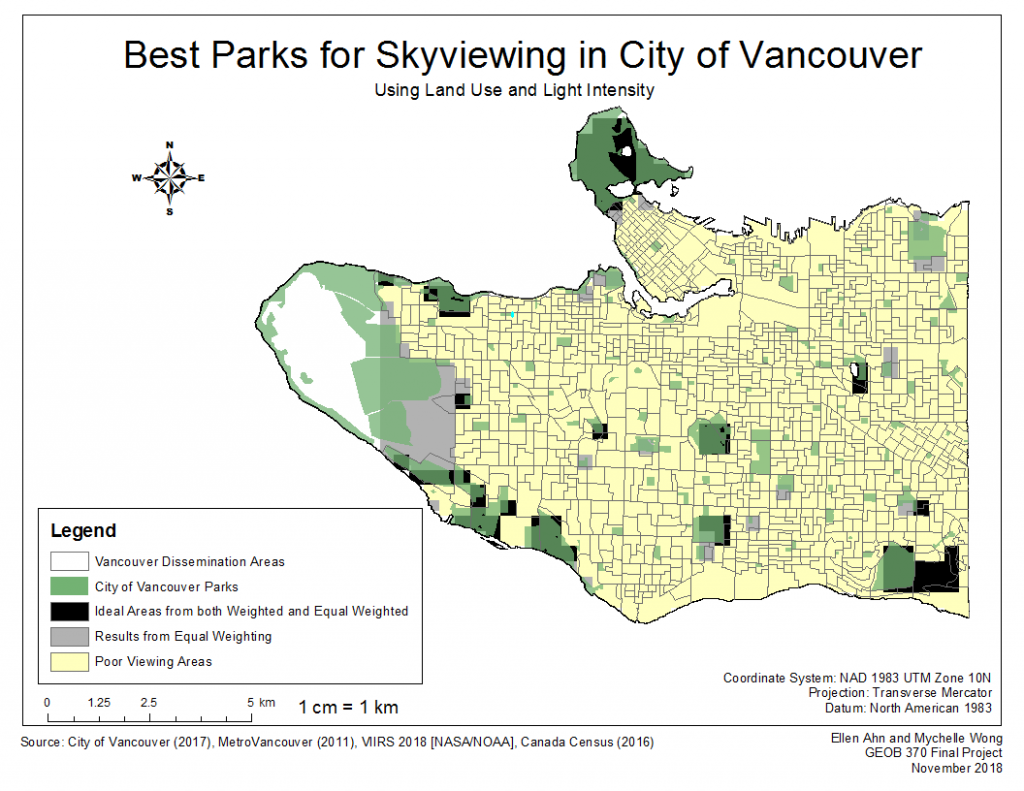
Figure 2. Results of the sensitivity analysis conducted for the land use MCE analysis. The areas that were determined as ideal sky viewing areas was conducted by combining the results of the weighted sums results with the equally weighted sums results.
The sensitivity analyses of our MCEs identified 10 parks and 5 golf courses as ideal locations for safe sky viewing in the City of Vancouver at night: 1 park for the crime density and street light density MCE (Figure 1); and 9 parks and 5 golf courses for the land use MCE (Figure 2). While these results are quite distinct, 4 (out of 9) parks identified as ideal locations in the land use MCE were found to be potential locations in the crime density and street light density MCE, and vice versa. Moreover, these results are consistent with our hypothesis that land use hierarchy by crime as a measure for safety will identify a greater number of locations than when using crimes and street lighting as a measure for safety. This prediction was based on, but not limited to, the following reasons: (1) land use throughout the City of Vancouver was ranked from 1 to 9 with respect to crime, where 1 indicated the lowest number of crime occurrences, thereby associating larger units of area to varying levels of crime than crime density; and (2) identification of dark skies was potentially affected by street lighting since it is a source of light pollution.
As aforementioned in the Results section, we chose 3 parks from a total of 15 parks and golf courses to discuss further in this section. While Humm Park was the only park identified as an ideal location for the crime density and street light density MCE, Queen Elizabeth Park and Spanish Banks Beach Park were chosen based on reasons such as percentage coverage of park’s area with ideal sky viewing areas indicated by the land use MCE and ease of access (with respect to modes of transportation) from a total of 14 parks and golf courses. In order to substantiate our findings from our analyses, we collected primary data from Humm Park and Queen Elizabeth Park.
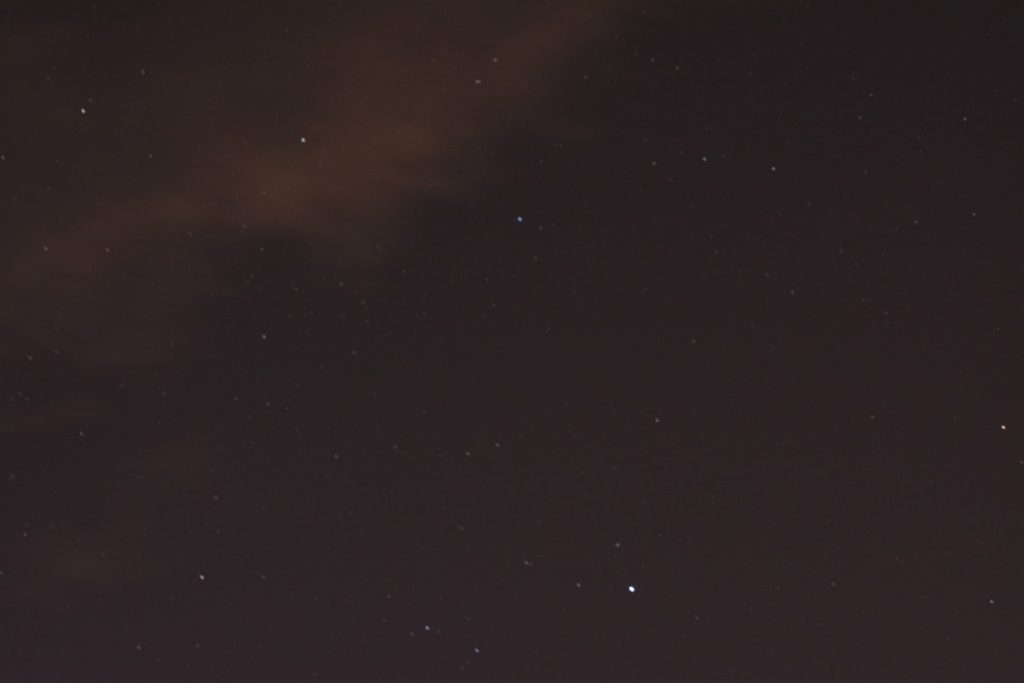
Figure 3. Night sky siew from Humm Park. hues of Orange across the dark sky is present due to light pollution from surrounding residential areas (Victoria-Fraserview Neighbourhood).
Our observations of the night sky from Humm Park are as follows: stars are visible, hues of orange indicate presence of light pollution, and further sky glow is faintly present above roofs of houses in the surrounding residential areas. Although we do not believe we saw the Milky Way, especially since peak viewing occurs in the summer months in the Northern Hemisphere, adequately dark night skies were found for stargazing.
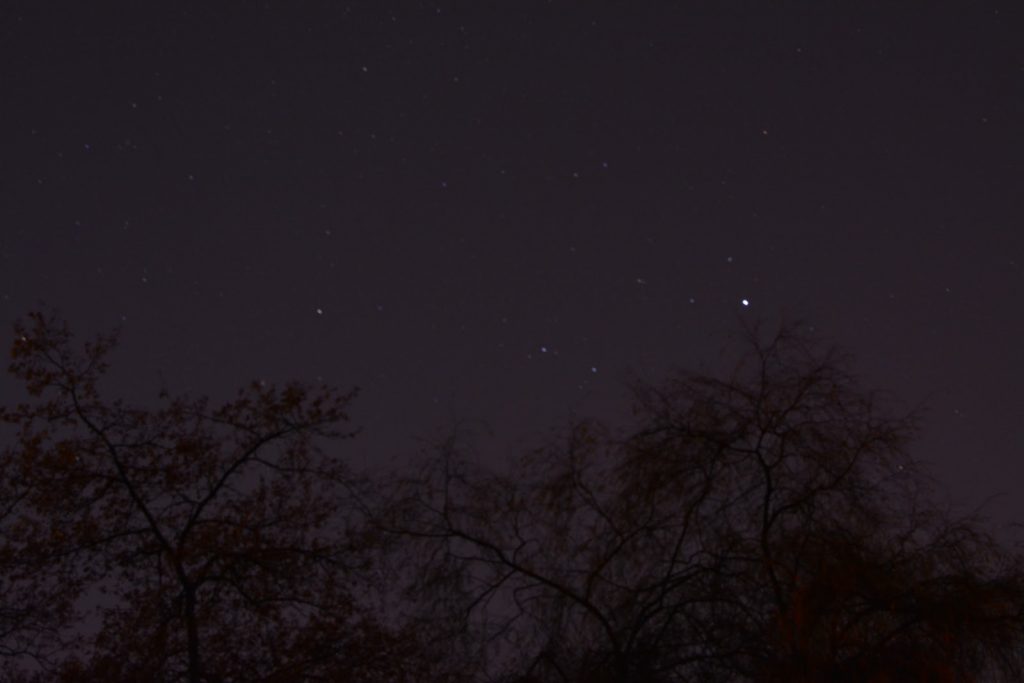
Figure 4. Night sky siew from Queen Elizabeth Park. Lots of vegetation throughout the park; Queen Elizabeth Park is famous for their well-maintained arboretum, or botanical garden.
Dark skies were also observed from Queen Elizabeth Park; which appeared to be on par with, or slightly darker than, Humm Park. This is likely due to the vast number of trees that compose their arboretum, or botanical garden, which shield light pollution emanating from surrounding areas. However, it is not completely without sky glow as hues of yellow were still present in the sky. Similarly to Humm Park, adequately dark night skies were found for stargazing. Additionally, we found both parks to be easily accessible from roads, except Queen Elizabeth Park did not offer free parking spaces which should be noted if seeking to access via personal vehicle; and felt relatively safe when visiting these parks. Nevertheless, it is important to note that perceptions of safety is highly subjective and will likely vary across individuals.
Due to time constraints and poor weather conditions, we were not able to visit and gather data from Spanish Banks Beach Park. However, the Royal Astronomical Society of Canada (RASC) Vancouver Centre, listed Spanish Banks amongst one of the locations that they frequent to view skies. As a charitable organization founded in 1931, the Royal Astronomical Society of Canada is Canada’s leading astronomy organization that works to advance education in astronomy (RASC Vancouver Centre, n.d.). Therefore, we are attributing their information on listed observation sites, that include Spanish Banks, as being credible. In addition, when searching through Reddit for personal experience with respect to sky viewing locations in the City of Vancouver, we found Spanish Banks repeatedly mentioned with positive feedback in various posts. Considering this, the results of our MCE analyses in identifying ideal locations for night sky viewing in the City of Vancouver is arguably robust given our primary data collection and secondary research.
Error & Uncertainty:
Crime data retrieved from the City of Vancouver, collected by the Vancouver Police Department (VPD), presents uncertainties and errors associated with the data collection and visualization processes. Application of geographic masking to ensure confidentiality of crime locations skew crime density to roads while land use hierarchy by crime could have been affected when shifting the placement of crime points from the actual location to another and subsequently crossing different land use boundaries. As well, the accuracy of data is at times compromised due to the time delays in crime reporting to the VPD (e.g. sexual assault reported months after its occurrence). Furthermore, the VPD utilizes “the most serious offence method” to determine what is fit to be recorded in their crime statistics – i.e., not all crime reports are recorded in the crime data. The latter problem could be mitigated if the VPD adopted an “all violations method” instead. The combination of these issues contribute to uncertainties and errors in the crime data.
Light Intensity data used in the analysis was was collected at a spatial resolution of 365 m by the VIIRS satellite. As the project area has a large scale and would require higher resolution data, the satellite data did not provide the ideal detail required for the analysis. Collecting data at lower resolutions leads to the generalizations about the amount of light than what an area truly experiences and contributes to the uncertainty in our MCE analyses. Streetlights are also a source of light pollution. and the generalization of the area can eliminate the effects of streetlights in areas with lower streetlight densities. As a result, light intensity data used in the MCE may underestimate the amount of Vancouver’s areas that are “poor sky viewing areas”. On the other hand, heavily forested areas such as Pacific Spirit Regional Park, may be attributed with higher light intensity values due to the collection of data at a lower resolution leading to the underestimation of “ideal sky viewing areas”. As this lower resolution data was used there is uncertainty in the identification of “ideal sky viewing areas”, during the reclassification step of the MCE, the “ideal” value that was used for the fuzzy membership reclassification was not 0, but 0.48 watts/square m. This midpoint was chosen as the raw satellite data did not have areas that experienced a light intensity of 0 watts/square meter and suggests that there are no skies in Vancouver that are completely unaffected by light pollution and contributing to the error and uncertainty in the light intensity data in the MCE analysis.
As well, in addition to the 14 parks and golf courses identified in the land use MCE, there are 3 additional parks that lie directly east of the Fraserview Golf Course, Everett Crowley Park, Champlain Heights Park, and Captain Cook Park. These parks were not found in the parks_lakes layer provided by the City of Vancouver. This may be because Champlain Heights Community Centre is located in this area, which suggest that these parks were excluded in this data file as may be under the jurisdiction of the Vancouver Parks Board. If we are to include these 3 parks, there is a total of 17 ideal sky viewing parks. Previously, the crime density and street light density MCE highlighted one park as an ideal sky viewing area, and the land use MCE highlighted a total of 14. Thus, the results are as follows if the 3 additional parks were included in our results:
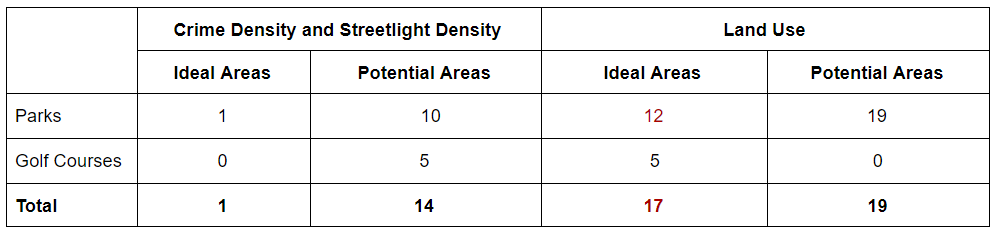
Table 1. Updated list of ideal and potential sky viewing parks. This is the result of the parks_lakes layer provided by the City of Vancouver not including Everett Crowley Park, Champlain Heights Park and Captain Cook Park. Numbers in red indicate the changes made from the initially observed parks that were identified in the Results section.
Least-Cost Paths:
The least-cost paths created from the 3 aforementioned parks (i.e., Humm Park, Queen Elizabeth Park, and Spanish Banks Beach Park) were calculated using the Burrard St. and Robson St. intersection in Downtown Vancouver as the source. The least-cost paths and the shortest distance (i.e., Euclidean distance) are measures of accessibility – it gauges approximately how easy it would be for someone who is at the source location to travel to these 3 parks at night.
Although, Jericho Beach also met the 4 criteria listed on the results section, we were also made aware during our secondary research and literature review that the H.R. MacMillan Space Centre and Gordon Southam Observatory is located at Jericho Beach which would not only have the darker skies, but also equipment to look at other objects in space. For the sake of ensuring accessibility, we chose parks that were also free to visit and were more readily available to the public.
As highlighted in the results section, the ranking of least cost path and shortest distance is as follows:
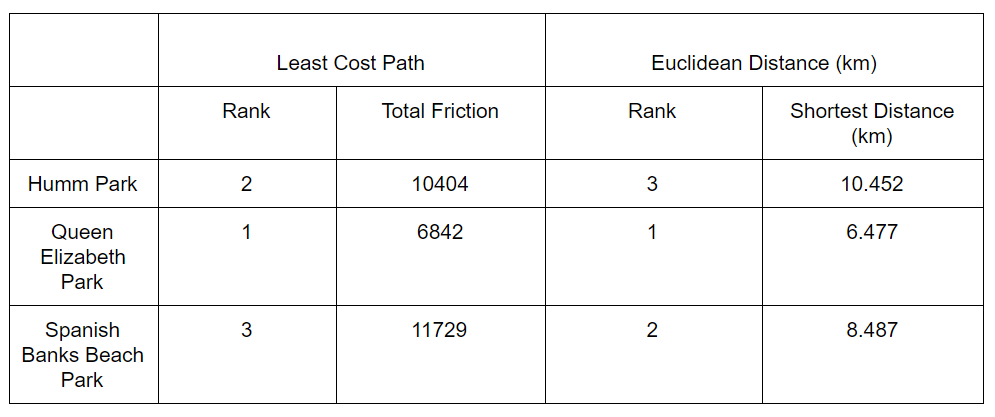
Table 1. The parks were ranked from 1 to 3 with 1 being the most accessible (least-cost path) or having the shortest distance, and 3 being the least accessible or having the longest distance.
In terms of costs, Queen Elizabeth Park ranked first for lowest costs in terms of distance from origin and the accessibility – with a total frictional distance of 6842. Humm Park had the second smallest frictional distance of 10404, and Spanish Banks Beach Park was found to be the most “costly” of the three parks with a total frictional distance of 11729. In terms of distance, Queen Elizabeth Park also had the shortest distance from downtown Vancouver to the park (approximately 6.48 km), Spanish Banks ranked second, and Humm Park was furthest away from the source in Downtown Vancouver. Map 3 below, shows both the shortest distance, because of the least cost path values are approximately equal to the physical transport distance, and the least cost paths for all 3 parks.
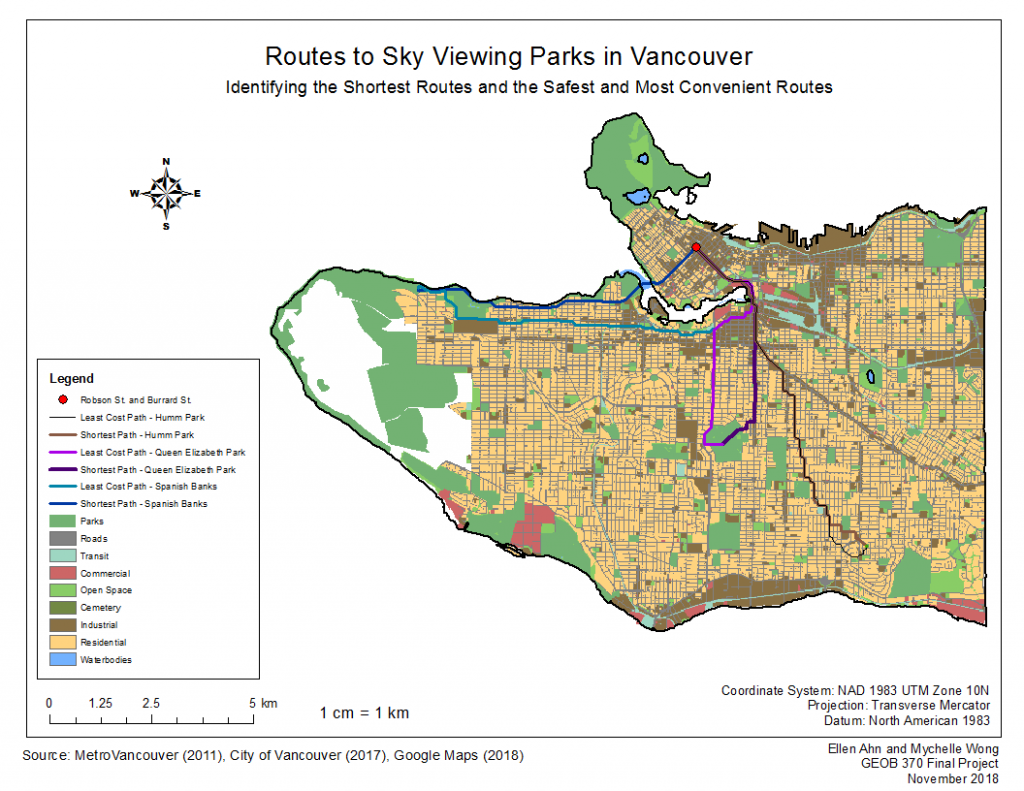
Figure 3. Results of the least cost path and shortest path analysis for Humm Park, Queen Elizabeth Park and Spanish Banks Beach Park. Paths are colored based on the park they are associated with. Analysis was conducted using the intersection at Robson St and Burrard St in addition to the land use cost surface created during the analysis.
A potential reason as to why the shortest path and least-cost path varies between Spanish Banks Beach Park and Humm Park is of how the land use, used as the cost surface, was classified (check Table 2 in the Methodology section). The cost values were determined based on how accessible and easy it is to transverse through a specific land use type, and how safe each land use type is. For example, roads were assigned a friction value of 1 to indicate the base cost as they are accessible at all times of the day (assuming for no construction work or traffic accidents). In contrast, water bodies were assigned a value of 200 as they are neither safe nor accessible at night. In the land use map, the center of Spanish Banks is surrounded by vegetation before one reaches the beaches, as the frictional value for traversing is relatively high compared to roads, this may account for the larger least-cost path value compared to the physical distance between Downtown Vancouver (Robson St. and Burrard St.).
Error & Uncertainty:
Land use data was used to create a cost surface for the least-cost path and shortest path from Downtown Vancouver (intersection at Robson St. and Burrard St.); however, after determining the least-cost path, it became apparent that there were missing information within the land use dataset. Calculating the least-cost path for Spanish Banks resulted in a path that transversed through the False Creek waterbody. When determining the cause in the creation of this path, it was found that the land use data did not include the the Burrard St. Bridge and the Granville St. Bridge that connect Downtown Vancouver to the rest of the city. The absence of this bridge suggests that there may be over estimations in both the least-cost path and shortest path, which means that both paths to ideal sky viewing parks located southwest of our original location in downtown may be over estimations of the “true” least-cost path and the “true” shortest path.
As well, there is uncertainty associated with the least-cost path and shortest path analyses as it excludes factors that would affect the route traveled, such as construction. Factors such as road construction are dynamic and would require real-time data on traffic and road conditions that the paths used for directions to a park. Another factor that is not taken to account when determining travelling routes is the transportation method by a person. In reality, the path an individual chooses to take will be affected by the amount the amount of time and money that one is willing to spend in order to travel to a park for sky viewing. The least-cost path in this scenario assumes that a tourist is travelling by car, bicycle, on foot, or other ‘free’ mode of transport as roads have the lowest friction value of all the land use types; roads have smaller frictional values as roads are available at any time. For example, a tourist may not be willing to pay money to rent a car or call a car share service. Although it may take longer time-wise, the public transportation systems may be a more viable option from their perspective. However, if one were to conduct a least-cost path to determine the best public transportation route, the analysis would be unreliable. Not all of the transportation data is included in the land use data. Furthermore, Night Buses play a significant role with respect to night-time accessibility, but this data is not included in the land use dataset as buses travel on roads. The transit system mapped in the land use data only takes into account SkyTrains and other trains. Further data acquisition is required to conduct a more accurate least-cost path is to include Night Bus routes, and assign friction values that which consider factors such as time and frequency of the transit.
Recommendations for Future Studies:
Throughout the Results and Discussion, our MCE analyses clearly illustrated the distinct findings from utilizing two different measures for safety in conjunction with light intensity to locate ideal and potential parks for sky viewing. As our measures for safety were relatively naïve in their conceptualization, largely due to time constraints and data limitation, we recommend future studies to incorporate a more nuanced measure of safety with further secondary research and further data acquisition. For example, an index for safety could be devised using a multivariate regression model with relevant variables (recommended from literature and credible sources) that fit the context of City of Vancouver. Similarly, the land use hierarchy by crime measure may benefit from testing for significant difference between each land use type’s crime level. For example, it may be unlikely that significant difference exists for all land use types in areas close to the borders (e.g., the division near commercial and transit-oriented). So, it may be beneficial to run statistical tests (e.g., regression discontinuity) for statistically significant difference. Depending on the results of the tests, rankings may need to re-assigned; for example, if there were no statistically significant difference between crime levels in commercial and in transit-oriented land uses, it may be more comprehensive to assign the two land use types the same rank. It will be interesting to see how the results compare with our findings, and what we can infer from such comparisons.
Lastly, as mentioned throughout our discussion, further data acquisition is recommended to further enhance our analyses. For the MCE analyses, time series data for crime could be acquired to capture temporal trends, which will allow us to observe for potential differences from our analyses that utilized data for a single year (i.e. 2017 crimes). Moreover, it would be beneficial to obtain data for parks under the jurisdiction of the Vancouver Parks Board to merge with what was obtained from the City of Vancouver. For the least-cost and shortest distance analyses, data acquisition of transit routes and Night Bus schedules, and real-time traffic data would help strengthen the accuracy of our analyses.