Methodology
Overview:
In order to determine the parks that may be suitable for night sky viewing, a multi-criteria evaluation (MCE) analysis was used to identify areas with little to no crime and little to no lighting. Safety was measured directly using the number of crimes that occur in Vancouver in a year in conjunction with street light, or using land use hierarchy by crime data. To compare the different measures for safety, two MCEs were conducted – one using the crimes and street lights; the other using land use. From the MCEs, 1 to 2 parks from each MCE were chosen and used to conduct least-cost and shortest distance analyses to the park from Downtown Vancouver.
Part I: Multi-Criteria Evaluation
- Using an Analytic Hierarchy Process (AHP) calculator, weights were determined using the following criteria:
- crime density is “slightly more important” than street light density
- light intensity is “significantly more important” than crime density
- light intensity is “significantly more important” than street light density
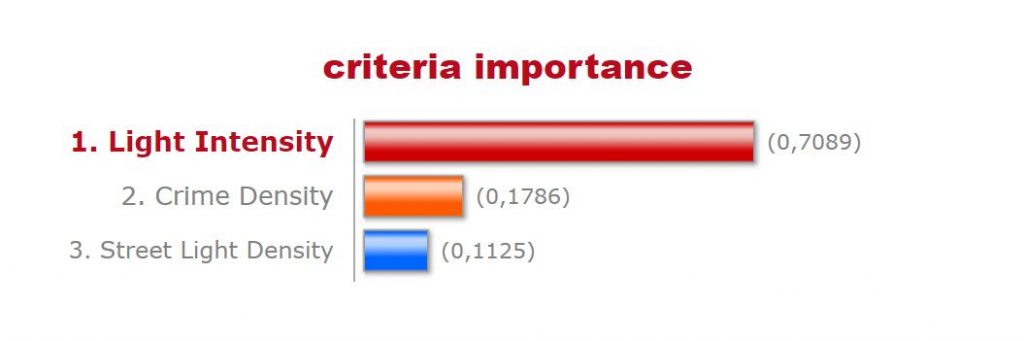
Figure 1. A screenshot of the AHP calculation used to determine the weights of the factors to consider. This result was used in both the land use MCE (i.e. light intensity given the same weight as above with land use given the combination of crime density and street light density weights) and crime and street light MCE. It was assumed that using crime density and street light density as a measure for safety would be approximately similar to using land use as a measure for safety.
- An MCE was created using the calculated AHP weights (i.e. weighted_MCE).
- To determine the confidence level of the analysis, a sensitivity analysis was conducted weighting the three different factors equally (i.e. MCE_33).
- A comparison was done by reclassifying the weighted_MCE layer with the MCE_33 layer. The sums were then used to overlap the weighted_MCE and MCE_33 layers. This resulted in the creation of three categories:
- Areas with large amounts of lighting;
- Areas that were identified as “Ideal Sky viewing” areas;
- Areas that were identified as “Ideal” that only appeared in the MCE_33 layer.
- This process was repeated using land use data for the City of Vancouver and light intensity data. The weighted values for the MCE conducted were 70% light intensity and 30% land use, this was based on the previous AHP calculation (land use hierarchy: a measure of safety as an equivalent to crime density and street light density, another measure for safety). To conduct the sensitivity analysis, the MCE, the layers were equally weighted with land use accounting for 50% of the weighted sum and light intensity accounting for the other 50%.
Overall analysis process:
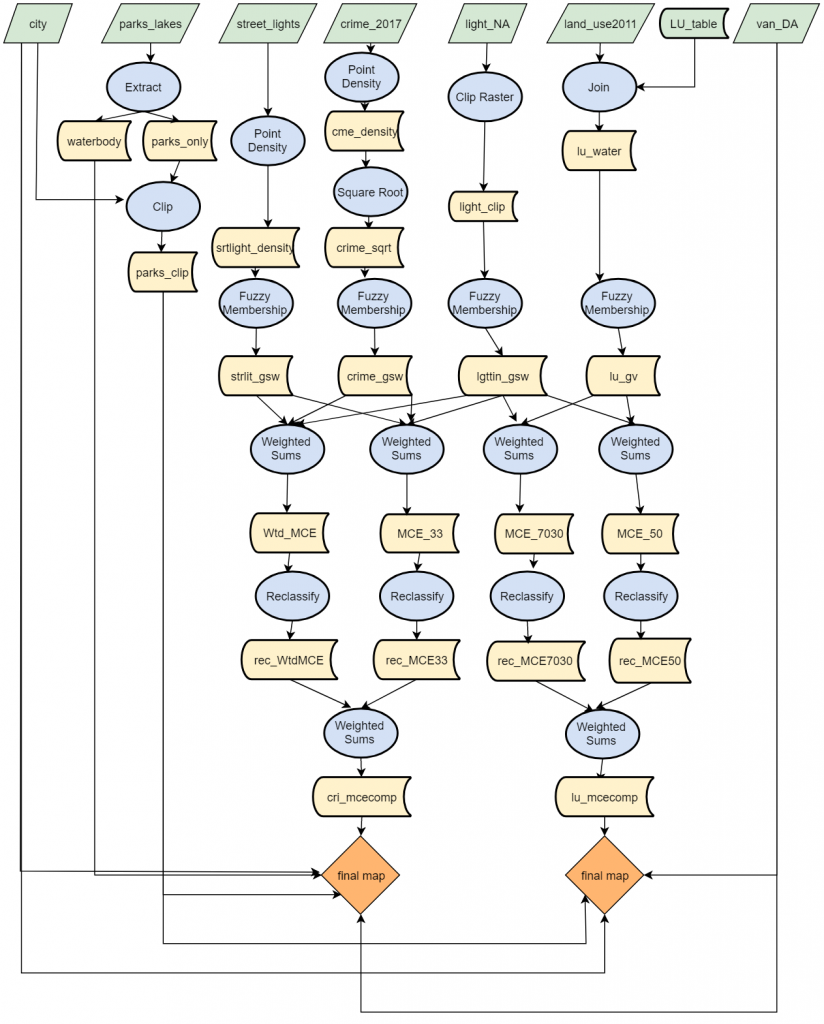
Figure 2. Flowchart showing data used for the analysis, parsing of data, and spatial analysis conducted for the MCE using crime density and streetlight density as well as land use as a factor of safety.
Part II: Least-Cost Pathway
- Determining Cost Attributes: Cost values were determined considering factors such as ease of accessibility and safety of each land use area. The following table contains the friction values for each land use type:
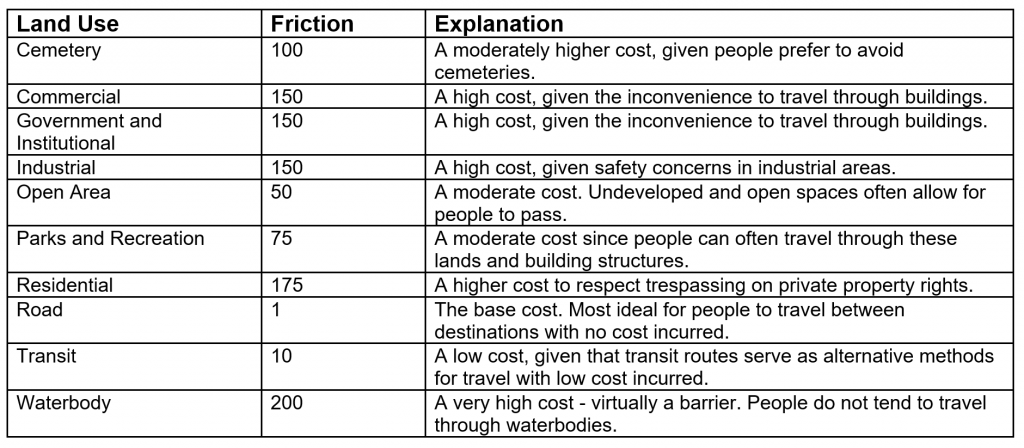
Table 1. Friction values that were used to create the Cost Surface. Land use polygons were assigned friction values based on their land use type.
- Creating the Cost Surface: The cost surface was creating using land use data for the City of Vancouver. Using the land use excel file provided by Metro Vancouver, the land classes were reclassified and friction values were appointed to each land use class. The table was then joined to the land use shapefile and saved as a new layer. The polygon was converted to a raster file for further processing.
- Determining a Source and Destination for Route: Parks that were highlighted as being potentially ideal were selected as destinations for our least-cost paths. The source was determined by choosing a tourist area in Vancouver in order to utilize a location frequented by both tourists and Vancouverites. The intersection at Robson Street and Burrard Street in Downtown Vancouver was chosen as the source as there are many sites to visit in this area (examples include Robson Square, Vancouver Art Gallery, stores and more).
- Creating a Cost Distance Surface: The “Cost Distance” tool was used to calculate the cost surface. Inputs for this include the source, the land cost raster. The outputs created from this spatial analyst tool will be used as inputs for later steps.
- Creating Shortest/Cost Path: In this final step, the cost-effective and shortest path for persons to travel was determined. Output data from the previous step was used to determine the shortest path. To determine the length of the path, the raster result was converted to a polyline to calculate the length in meters.
Overall analysis process:
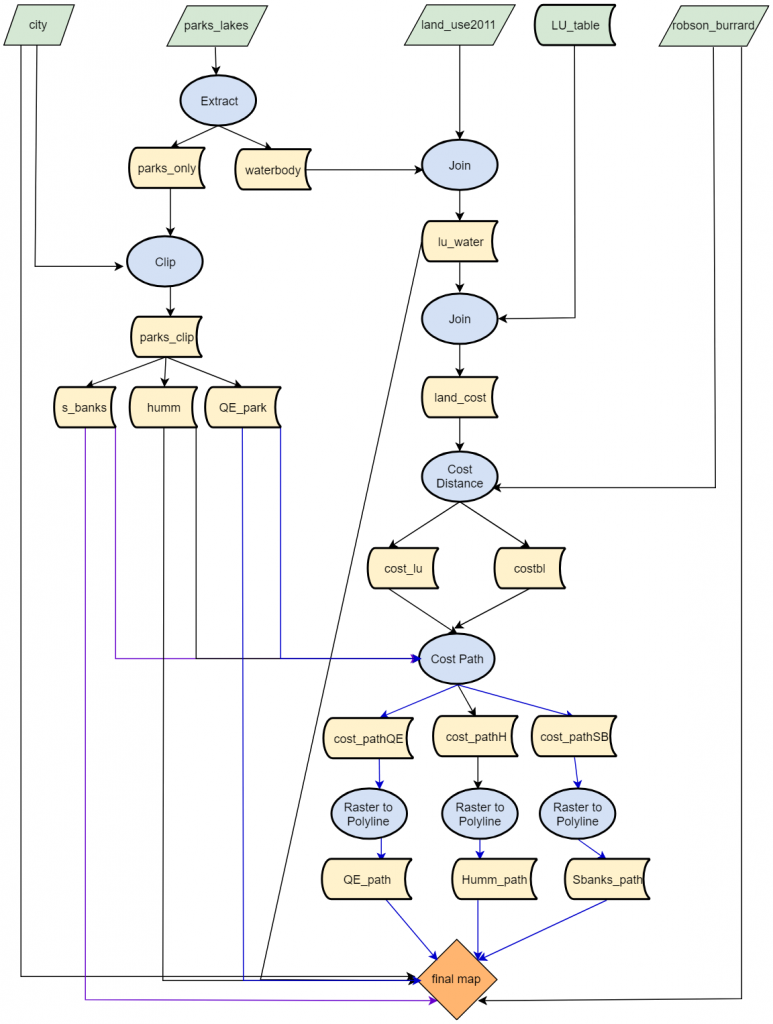
Figure 3. Flowchart showing data used for the analysis, parsing of data, and spatial analysis conducted for the least-cost pathways created for the selected parks that were identified as being ideal sky viewing areas.