Housing Affordability
The objective of this class project was to produce a map that indicates different housing affordability levels in the City of Vancouver and Ottawa using Canadian Census Data. Outcome of this lab are as follow:
- Developed working knowledge of Canadian Census Data through using 2011 Census Data in mapping housing affordability.
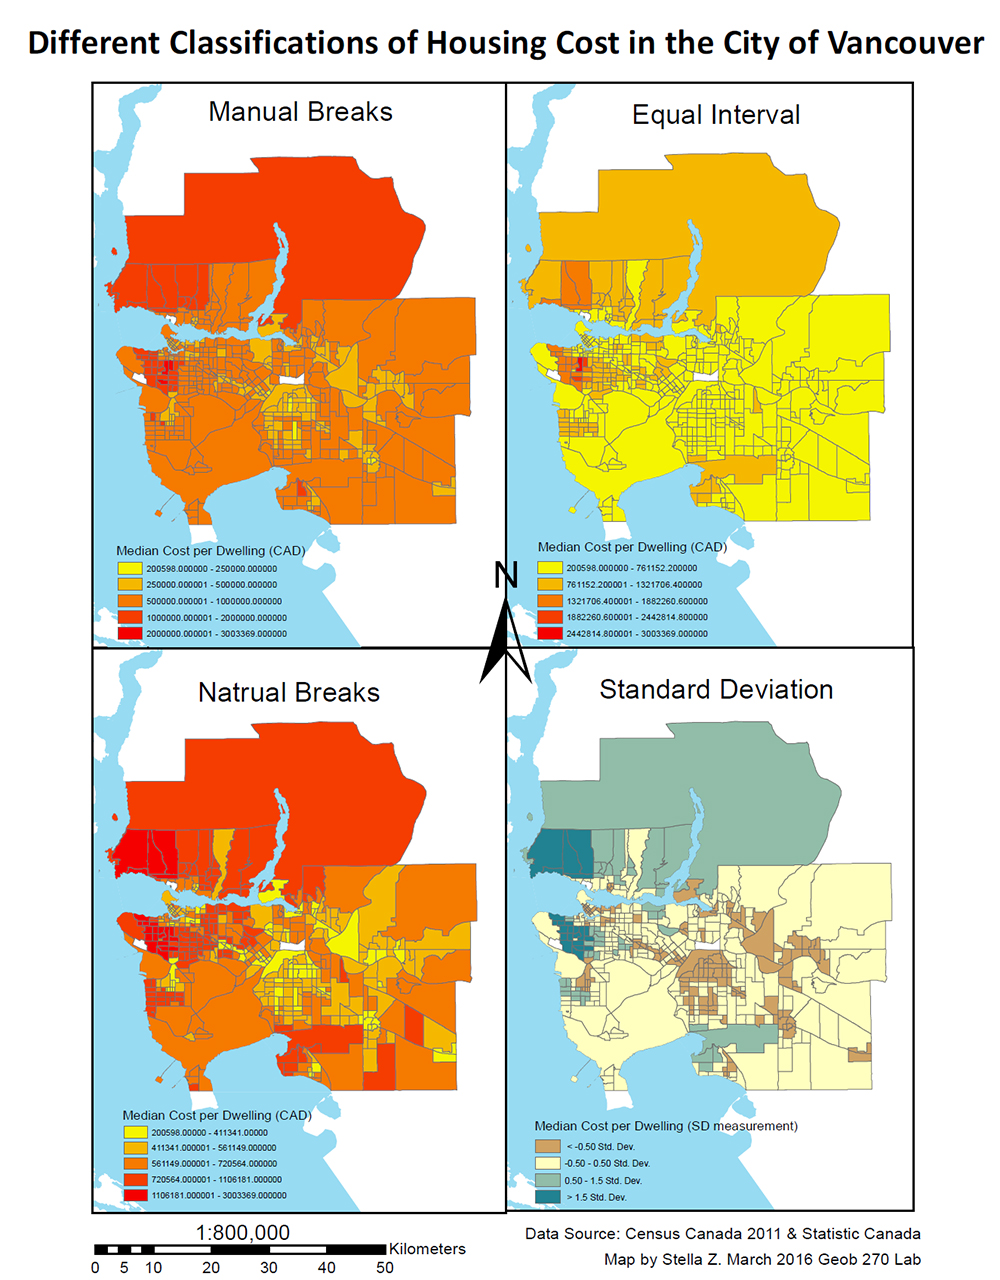
- Practiced various quantitative data classification methods, and compared their difference in order to evaluate each methods visual and social impact.
- Gained information on housing affordability standards and data and how this information is utilized by different business and social groups.
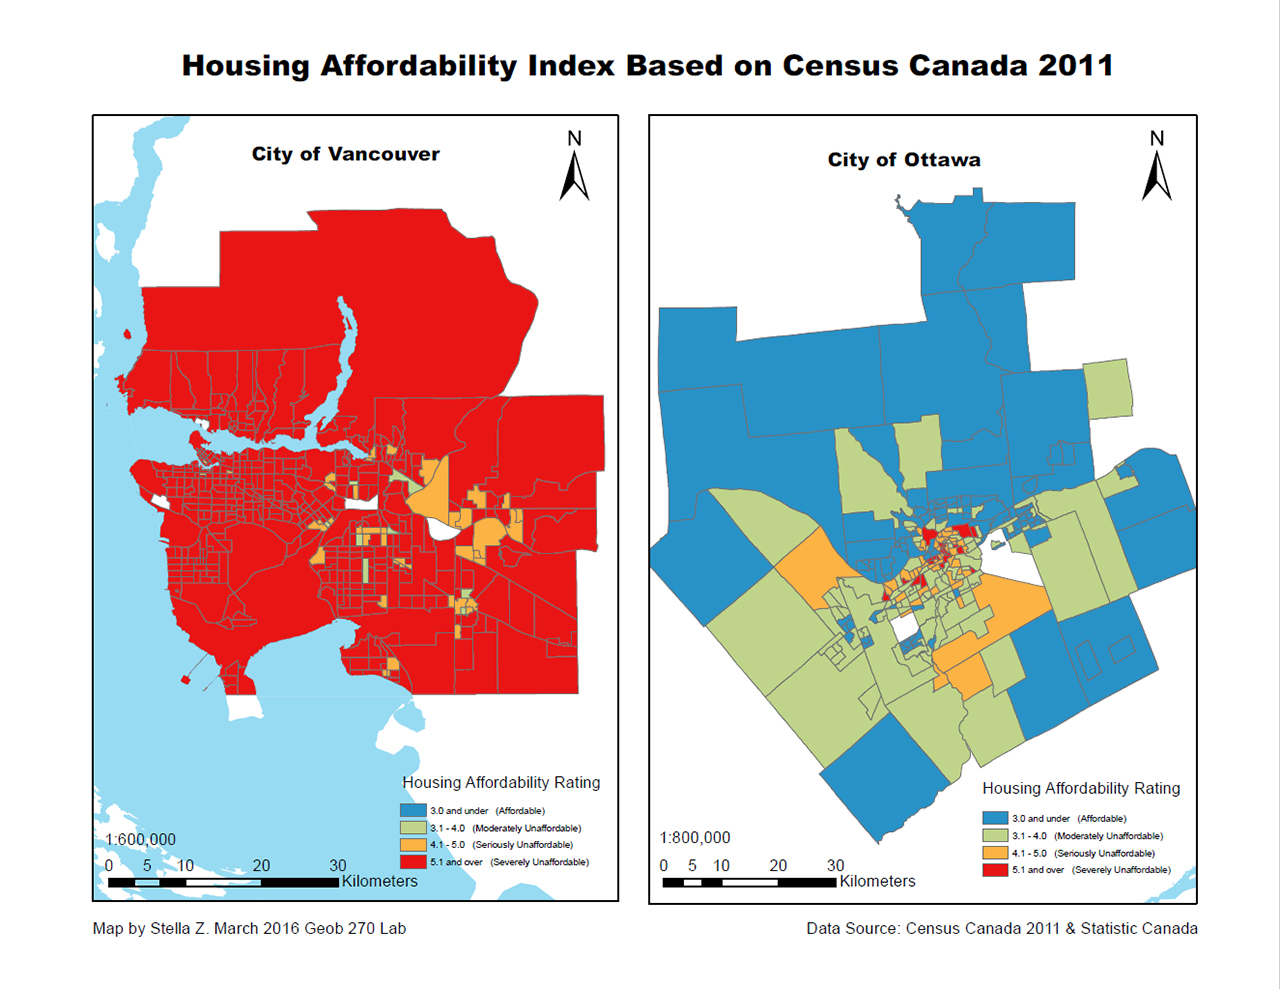
Housing affordability is measured by the ratio between a family’s median income and the average housing cost. This indicator is better than using housing cost alone because it takes into consideration the different income levels between cities and census tracts.
The hosing affordability rating is divided into 4 categories. If the median multiple is under 3.0, it would considered as affordable housing; 3.1-4.0 is moderately unaffordable, 4.1-5.0 is seriously unaffordable and 5.1 & over is severely unaffordable. This rating system is determined by the 12th Annual Demographia International Housing Affordability Survey. However, the data cannot be fully trusted because it can be used by different organizational groups for various purposes. Therefore the maps of housing affordability produced can be extremely different based on the classification method they choose.
The question is whether affordability is a good indicator of a city’s ‘liveability’? Despite that fact that housing makes up an important part of a family’s life in a city, it should not be considered as the sole indicator of a city’s liveability. Other aspects such as price level of essential needs, accessible public services and transportation, citizen lifestyle, available urban green space and community developments also contribute to a city’s liveability.