Social Vulnerability: Hotspots and Natural Hazards
 Figure 1. Hotspot analysis of weighted isolation index.
Hotspot cluster analysis reveals populations vulnerable to social isolation according to the AHP and associated factor weights assigned. Cold spots relate to areas deemed low risk for social isolation. These areas are identified as statistically significant concentrations of high and low isolation index values, using the Getis-Ord Gi* statistic. Cold spots are most strongly concentrated in Tokyo’s densely populated central core. Extensive urban rail systems and medical facilities in this area will impact the weighted analysis. It is interesting to note, however, that areas along metro lines typically have high population density. Peripheral areas of all prefectures in the study area show some clustering of vulnerable populations, of note are the western regions of Saitama, Tokyo, and Kanagawa prefectures and coastal regions of Chiba prefecture. These phenomena are represented visually in Figure 1.
Figure 2. Tokyo’s ‘One Metropolis, Three Prefectures’ area: social isolation hotspots and natural disaster risks.
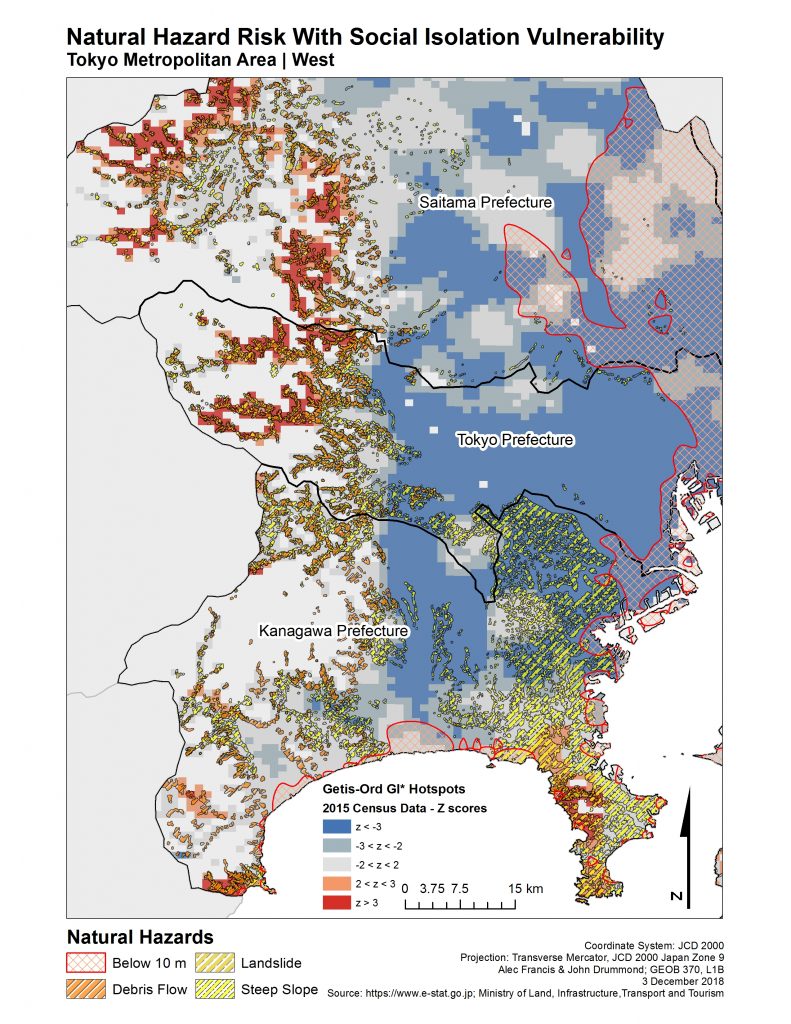
Japan’s physical geography is characterized by mountainous topography, exposed coastlines, as well as frequent and severe seismic events. Our analysis looks at natural hazard risks in relation to social vulnerability in the study area. With landslide, debris flow, and steep slope hazard data overlaid upon the hotspot analysis, we noticed the western regions of Saitama, Tokyo, and Kanagawa prefectures faced risk of mass wasting. Hot spot clusters of the social isolation vulnerability index in these regions often lined up exactly with known slope hazards. Figure 2. illustrates the overlap of social vulnerability and vulnerability to natural hazards and Figure 3. provides a closer perspective in the wester region.
Figure 3. Western region natural disaster hazards.
Grouping Analysis
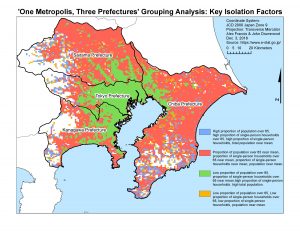
We conducted a grouping analysis for populations over 65, single occupant household over 65, single occupant household, and total population. This grouping analysis is reproduced here as Figure 4. We observed stretches of census grid squares with high proportions of populations over 65, high proportions of single occupant households over 65, and high proportions of single occupant households that aligned with mass wasting hazards in western Saitama, Tokyo, and Kanagawa. In the event of a mass movement disaster, these areas may face compounded impacts as a result of natural disaster and isolation from community. Additionally, with above average aged populations and especially in areas with high concentrations of seniors living, there is an increased risk of mobility or health issues that may pose further challenges in the event of a crisis.
Figure 4. Four-factor grouping analysis.
A second grouping analysis incorporating the 10 factors of the isolation index (as outlined in Methodology) aggregated into two groups corroborates the results of the hotspot analysis and four factor grouping analysis. The 10-factor grouping analysis divides the census polygons into two groups: one where the risk factors exceed the mean, and one where the risk factors are less than the mean. The areas of risk identified by the grouping analysis correspond closely with those identified in the hotspot analysis. We see the same pattern of socially vulnerable and ageing populations clustered in peripheral suburban and semi-rural regions. These risk regions are typically characterized by low population density, and lack of access to public facilities. Figure 5. shows the areas identified by the 10-factor grouping analysis. No spatial constraint was specified, and Arc assigned 2 groups as the optimum number for classification. Figure 6. shows the population density of the Tokyo area. It is interesting to note how closely the areas of high social isolation risk (as identified in the grouping analysis) are correlated with the areas of low population density.
Figure 5. Grouping analysis of the 10 isolation index factors.
Figure 6. Population density of the Tokyo Metropolitan Area.
Tsunami and Flooding Risk
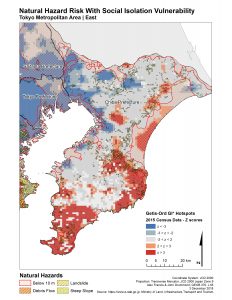
Inundation due to flood, sea level rise, or tsunami is another natural hazard risk that Japan faces (Sumanuma, 2016). As low elevation and coastal areas in the study area face increased risk of inundation, a map layer showing areas at greatest risk was included in the analysis. Coastal areas of Chiba prefecture show potential inundation areas that encompass populations vulnerable to social isolation. These are shown in Figure 7. Further, large portions of Tokyo and Saitama face risk of inundation. Saitama and Tokyo show less social isolation vulnerability in these areas, yet these densely populated areas are still exposed to natural hazard risk.
Figure 7. Natural hazard risk in the eastern portion of the Tokyo Metropolitan Area.


