Musical Preferences and Network Visualization: Insights from the Golden Record Quiz
The Golden Record Curation Quiz encourage tasked us as a participant to pick music tracks that best represent humanity.
Last week, Based on The Voyager Golden Record: Humanity’s message to the cosmos (NASA, n.d.) podcast, I have selected below 10 pieces:
- India – Raga, “Jaat Kahan Ho” – Click here to Listen
- Mexico – “El Cascabel” – Click here to Listen
- Germany – Brandenburg Concerto No. 2 in F, First Movement – Click here to Listen
- United States – “Johnny B. Goode” – Click here to Listen
- Japan – Shakuhachi, “Tsuru No Sugomori” (“Crane’s Nest”) – Click here to Listen
- Peru – Panpipes and Drum – Click here to Listen
- Georgia – “Tchakrulo” – Click here to Listen
- Senegal – Percussion – Click here to Listen
- China – Ch’in, “Flowing Streams” – Click here to Listen
- Austria – Mozart, The Magic Flute, Queen of the Night Aria – Click here to Listen
After that My Professor Ernesto consolidate the date which includes all the students data together. The results were turned into a dataset and visualized using Palladio which is a tool that groups people based on shared selections.
This post explores what the visualization shows and what is misses about our music choices, cultural representation and how data can shape our understanding. I have followed series of steps to understand the data.
Step 1: Understanding the Network Visualization: After loading the dataset into Palladio, the tool created a network connecting participants (curators) to their chosen tracks. What I can see here the people who picked the same tracks were grouped together into six clusters.
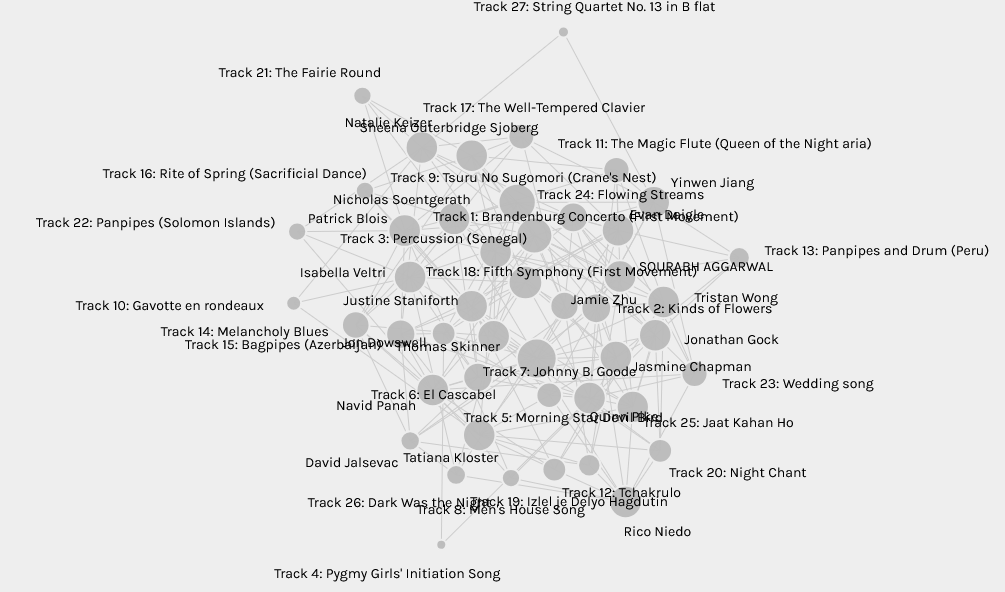
Step 2: How Music Choices Form Groups: In this step, I dig deep into and focus on people who selected similar tracks were groups together, revealing patterns in music preferences. I did notice that some tracks connected multiple groups, showing they were more widely recognized.
Popular examples include:
- Brandenburg Concerto (First Movement) (Classical)
- Johnny B. Goode (Rock & Roll)
- Percussion (Senegal) (Traditional African music)
I did realized that less common tracks were isolated, meaning fewer people selected them. This may be due to lack of exposure rather than lack of interest.
Step 3: What the Data Doesn’t Show: This visualization doesn’t explain why people made certain choices or why they didn’t choose other tracks. Now, what I am thinking “Did people avoid certain tracks because they didn’t like them or because they did not know them? I have observed an interesting element that Palladio does not show null choices so we we don’t know whether people skipped tracks due to lack of familiarity. It might shows is there is a cultural bias in the data. This suggests a Western music dominance (Music from Earth, n.d.). Another factor is personal reasons for picking songs are missing. People may have chosen tracks based on memories, academic knowledge, or random selection, but the visualization does not show these motivations.
Step 4: The Bigger Picture: Social and Political Implications: In this last step, I have realized that grouping people based on music choices has broader effects ranging from it reinforces dominant music traditions to the map doesn’t show music people avoided. It assumes shared identity based on selections. Just because two people picked Brandenburg Concerto and Percussion (Senegal), it doesn’t mean they have the same musical background or taste. If Palladio could display tracks that were deliberately not chosen, it might reveal even more about cultural perspectives (Taylor, 2019).
Conclusion:
Palladio provides an excellent way to see how music choices bind us, but it also has limitations. By questioning why people made their selections and considering what the data leaves out, we get a transparent picture of how digital tools influence our understanding of cultural preferences.
References:
Music from Earth. Links to an external site. (n.d.). NASA.
Taylor, D. (Host). (2019, April). Voyager golden record Links to an external site. [Audio podcast episode]. In Twenty thousand hertz. Defacto Sound.