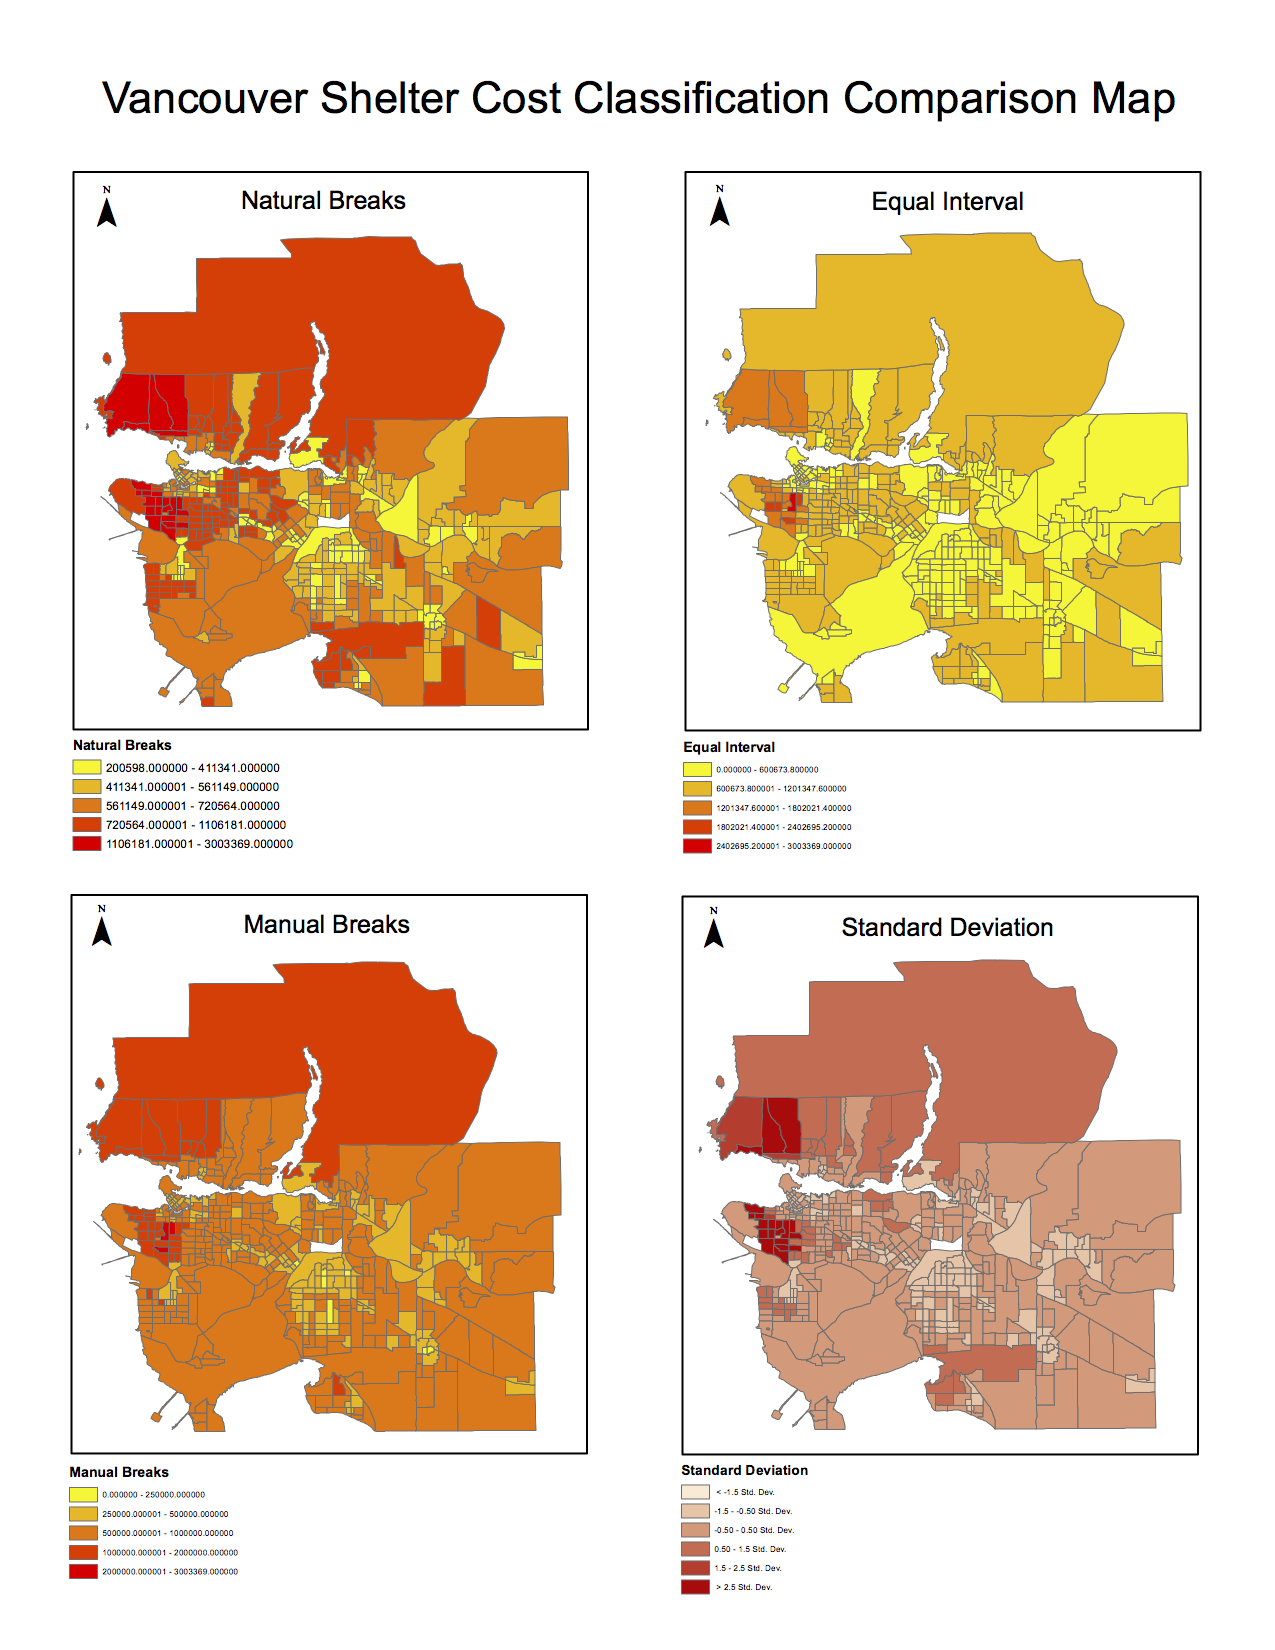
Quantitative Data Classification
This map shows the Vancouver’s Shelter Cost Classification by 4 different methods of classification: natural breaks, equal interval, standard deviation, and manual breaks.
As seen form the comparison, same data can be displayed differently. Therefore, those different maps might be used by different people for different purposes. For example: a journalist might use a “Natural Breaks” map to show a more exaggerated and dramatic data to get more attention for their news. However for a real estate agent selling houses around UBC in this case, he/she might use “Equal Intervals” map to indicate that UBC’s houses are at lower cost range (which means UBC’s property prices are not expensive), then attract more potential buyers. From this we can learn that although the data is identical, the maps could be biased for map creator’s own purposes. Thus ethical awareness arouses in this regard.
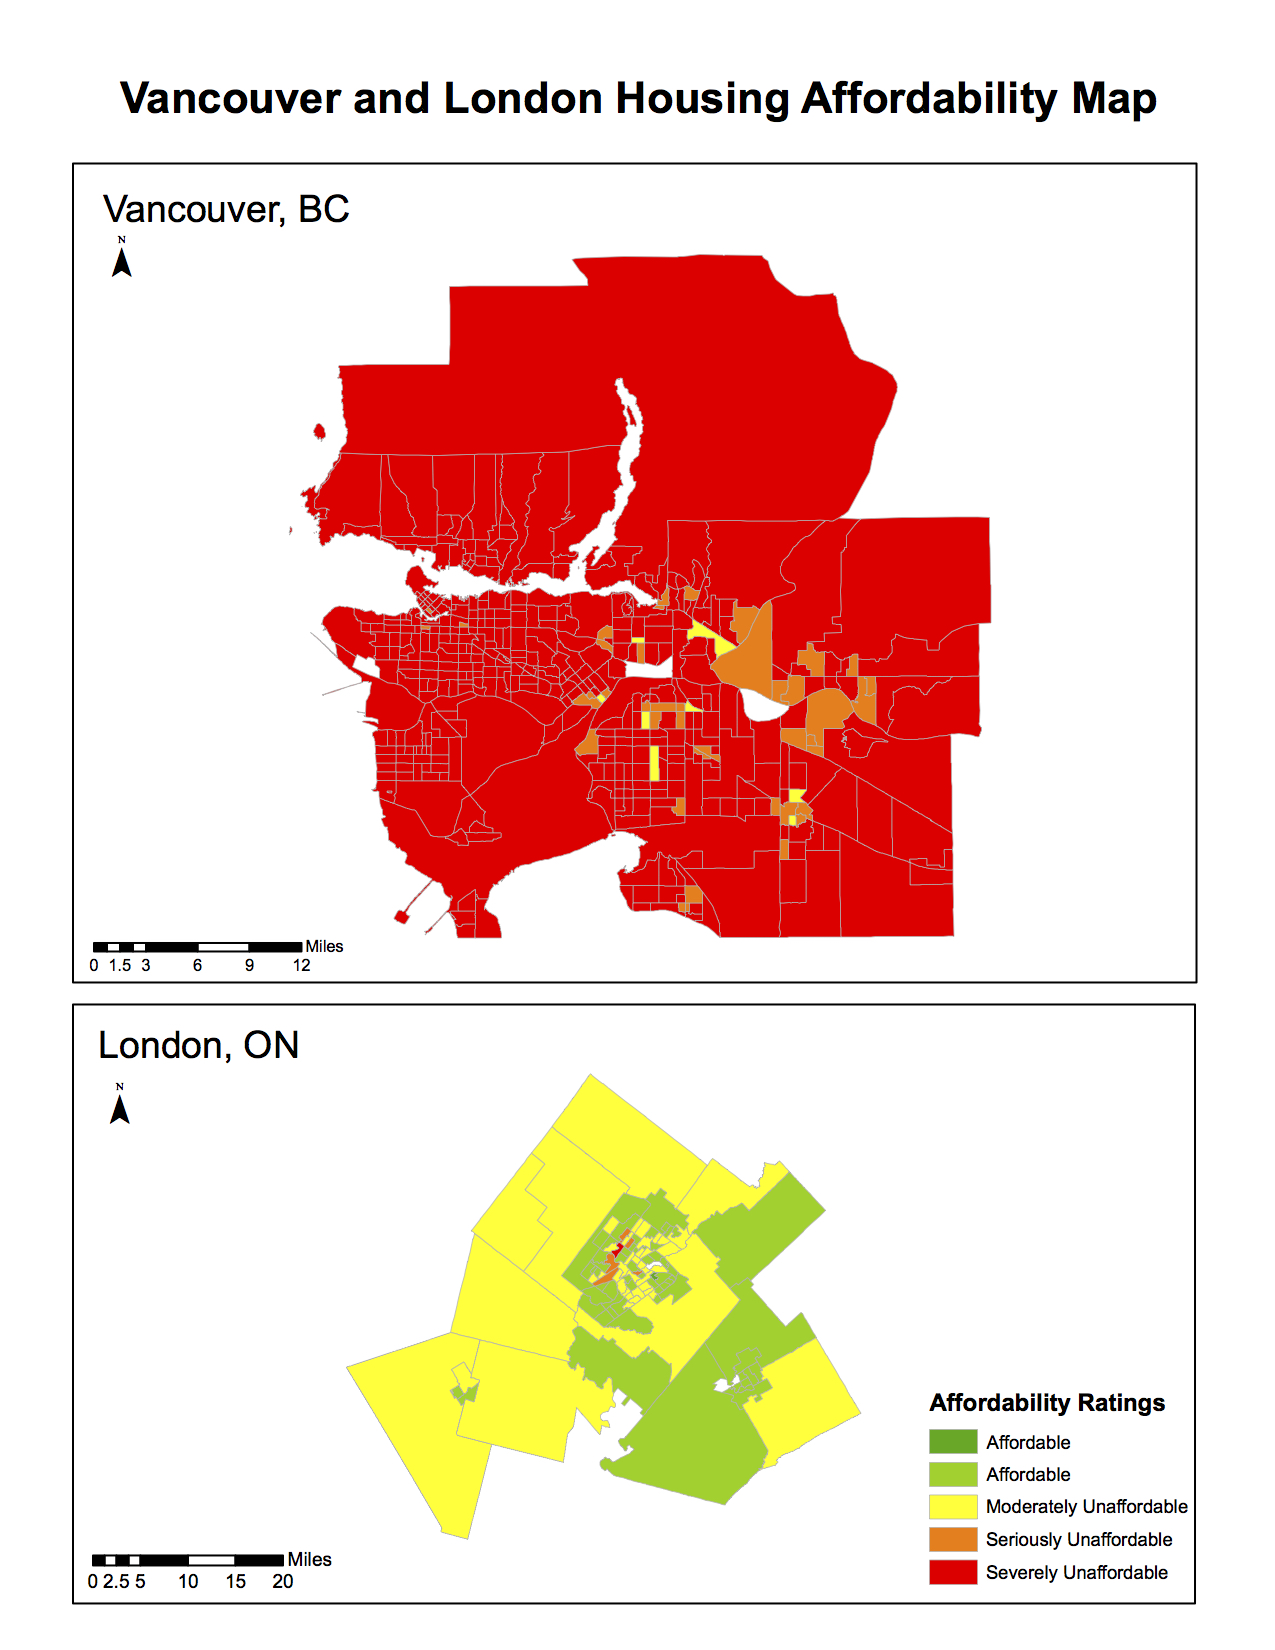
Housing Affordability
The following map compares the affordability of housing in Vancouver, BC and London, ON. Housing Affordability measures the housing cost in relation to the income in each city, the index is calculated by normalizing house cost by income. It’s hard to determine the affordability by looking at housing cost alone because different cities have different economic profiles, their housing costs and incomes differ dramatically and it is hard for analyst to compare. Therefore the normalization is a better method to measure the affordability.
The Affordability rating are classified into categories: Affordable (3.0 & Under), Moderately Unaffordable (3.1 to 4.0), Seriously Unaffordable (4.1 to 5.0), Severely Unaffordable (5.1 & Over). The category is determined by “Demographia International Housing Affordability Survey”. They determine the categories by the the median multiple method (median house prices / median household incomes). This is a relatively trusted source and this benchmark system is widely used in 9 countries. However recent media have also criticized this system’s inaccuracy and biases. More investigations needed be carried out to determine its credibility.
Affordability is one of many elements that determine a city’s livability, however it’s not the only factor that determine the whether the city is livable. We also need to consider other factors like employment opportunities, security, natural environment, infrastructures, education, health and etc. For Vancouver even its considered as a very unaffordable place to live, it is the 3rd most livable city in the world.