
Background
- Department of Institutional Research approached the CM Digital Team to develop a new at-a-glance, dashboard for important, publicly-shareable College metrics
- Total of nine (9) Tableau dashboards outlining demographics and composition of the student body.
- Tableau dashboards, needed to be mobile-friendly
- Each dashboard featured multiple dimensions including:
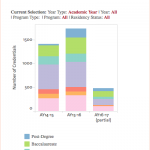
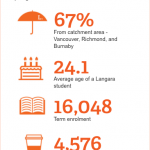
- Term-by-term Registration Numbers
- Aboriginal student enrolment
- Residency status of students
- Country of origin for student body
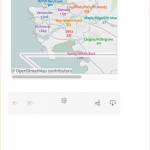
- Lower Mainland city of residence
- Age group and gender
- Students by program
- Credentials awarded
Role
- Developed a solution to make Tableau dashboards available on mobile devices by swapping CSS display: show/none; with viewport media queries for 2 separate desktop and mobile dashboards
- Hide 300px wide Tableau dashboard for desktop query
- Show 500px wide Tableau dashboard for mobile query
- Designed visually appealing vector graphics and icons to showcase key College metrics (Adobe Illustrator and Photoshop)
- Led creative vision, prototyping, and designs for mobile, tablet, and desktop viewports
- Responsive CSS and HTML in Coda and Sublime Text
- Development, testing, and production sites managed in Cascade Server CMS
- Worked in collaboration with client for review and content approvals
