An excerpt from Srinivasan et. al. article on Reality versus Simulation is a perfect example of the importance of information visualization for mathematics. One of the participants in the study discussed in Srinivasan et. al’s article states, “…when you’re getting the signals on the computer all you’re doing is typing the equation and getting a graphic, but when you’re getting it on the lab equipment, you’re actually setting frequencies and … it seems more real” (Srinivasan et. al., 2006, p. 139). Every teacher tries to do his/ her best to be able to help students understand the learning outcomes of a lesson and it becomes even more rewarding for a teacher when a child is able to visualize the learning and see it as something “real”. Information visualization helps teachers across the globe achieve that reward of helping students see textbook problems as “real” problems.
According to Edens and Potter, “Visual-spatial representations may function as mental imagery, or in the “mind’s eye””(Edens & Potter, 2008, p. 184). Being able to visualize something really is being able to see it with the mind’s eye. I always find myself looking in the space, staring at nothing when trying to visualize something, as I am trying to see it with my mind’s eye. As it is widely seen that students are mostly interested in just finding the right answer and moving on to the next question. As Edens and Potter call these students the ‘number grabbers’ as they like to ‘compute first and think later’. I think in a situation as such, it is even more important for students to be able to visualize the problem before solving it.
I have chosen to apply T-GEM instruction framework and combine it with NetLOGO digital simulation introduced in this lesson. I think in my grade 8 honors class while teaching the graphing units where I introduce rate-of-change, I could use NetLOGO as the online simulator to help students visualize how a graph might get affected if the speed of one car changes compared to the other car at the constant speed. I will be using the “Traffic Basic” simulation on NetLOGO for this lesson activity starting with one red and one blue car.
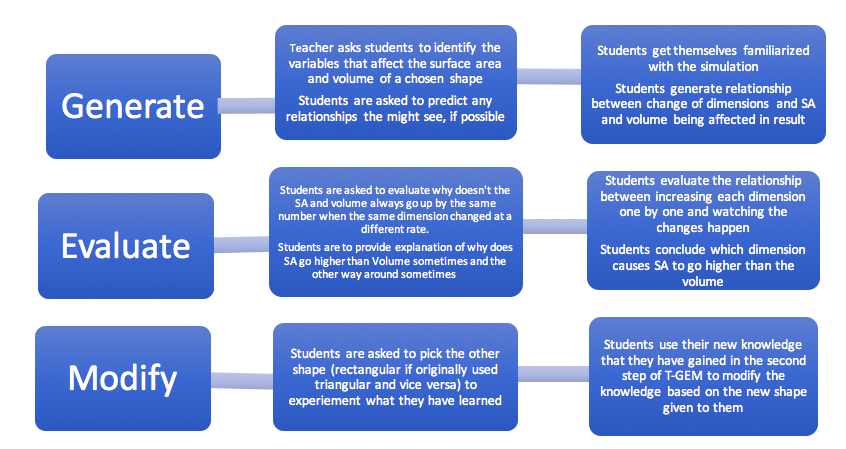
Generate:
Step 1: Students are asked to identify the variables that affect the speed of the red car.
Step 2: Students are asked to get familiarized with the simulation and generate relationships between the speed of the red car and acceleration and deceleration
Evaluation:
Step 3: Students are asked to evaluate why are there two controls given to control the speed of the red car- acceleration and deceleration.
Step 4: Students are asked to evaluate the relationship between acceleration and deceleration and how they affect the speed in different ways
Modify:
Step 5: Students are asked to try using more than 5 cars at a time to experiment how the graph may get affected when the speed is played around with.
Step 6: Students use the new knowledge gained through the second step of T-GEM to modify the knowledge and find a relationship between acceleration and deceleration with more than 5 cars at play.
References:
Edens, K., & Potter, E. (2008). How students “unpack” the structure of a word problem: Graphic representations and problem-solving. School Science and Mathematics, 108(5), 184-196
Srinivasan, S., Perez, L. C., Palmer,R., Brooks,D., Wilson,K., & Fowler. D. (2006). Reality versus simulation. Journal of Science Education and Technology, 15 (2), 137-141
https://www.netlogoweb.org/launch#https://www.netlogoweb.org/assets/modelslib/Sample%20Models/Social%20Science/Traffic%20Basic.nlogo