Category Archives: C. Information Visualization

Revisiting Grade 3 Buoyancy Misconceptions Using TGEM & PhET

As I was reading the instructions for this post I decided to remix one of my earlier ideas (which I had posted so late passed the deadline I missed the chance at peer interaction) because it fit so well into this assignment (and I was proud of it and wanted it to have another chance at generating conversation!) 😉

I chose to focus on the TGEM framework and utilized a PhET applet. The misconception I selected was that of buoyancy and its relationship with gravity/mass/density. As I pointed out in the first iteration: In Grade 3, students in Ontario study material forces. I recall classes having a hard time understanding why the buoyant force allowed certain objects to seemingly overcome the force of gravity but not others. The concepts of mass, volume, and density are not solidified at this stage so explanations or even demonstrations were not usually deeply understood. There are several buoyancy simulations available online but I feel the PhET one described below is the most useful. As Finkelstein et al. (2005) mention PhET simulations “are designed to be highly interactive, engaging, and…provide animated feedback to the user. The simulations model physically accurate, highly visual, dynamic representations of physics principles” (p.2).  Furthermore, this particular Info-Vis simulations also provides a ready-made set of data (which I considered “large” for the purposes of primary education) required within the GEM framework that the students could refer back to as they gained deeper understanding of what they were looking at (Khan, 2007).


If I had an opportunity to teach this Science unit again using T-GEM cycles and Info-Vis applets the lesson activities might look something like this (over a series of classes, I’m sure)…


Buoyancy & Mass Lessons ala TGEM & PhET


Step 1: Compile Information – I would begin with showing students a data table for five blocks of mystery objects from the PhEt Density & Buoyancy Simulation and demonstrating how to read a two-column chart. Then we would briefly discuss what students know about these objects, the abbreviations (what does L and kg stand for?) and the numbers beside them (making a connection to money when reading decimals, are these numbers placed in any particular order?). Add keywords to a word wall: litres (L), kilograms (kg).

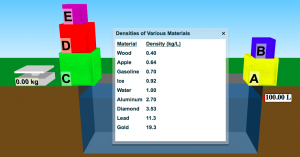
Source: https://phet.colorado.edu/sims/density-and-buoyancy/density_en.html

Step 2: GEM Cycle 1

Generate – Then, I would begin by asking students to find trends or generate some relationship statements about the data in groups and share with the class. For example, “The water has the smallest number but the gold has the largest number” or “I wonder why gasoline is smaller than water? Aren’t they both liquids?” Other questions related to the nature of the data the teacher might guide discussions of include: “What might ‘density’ be measuring?”, “Why is the pool measured as 100 L but the scale measuring 0 kg right now?”


Then, I would direct their attention to the cubes and ask them to explain what they see: Each shape is a cube, they’re five different sizes, five different colours, labelled with five different letters. I would ask them to put the cubes in order in two ways (letter label and size) and then to predict what the scale would read if I were to measure each cube. (I would deliberately not use the term “weigh” or introduce the term “mass” at this point). I would also ask them to predict whether they think any of the numbers on the data table might appear on the kg scale and whether/how the 100 L measurement of the pool might change.


Then, I would ask students to predict which cube would measure the highest number when I place it on the kilogram scale. (They will likely say the largest cube will be highest and smallest lowest and I will add the word “size” to our word wall). I would ask them to write a rule explaining what they think the relationship between a cube’s size and its kilogram measurement.


Evaluate – Now, I would begin the simulation by placing each cube on the scale and have a student scribe for the class to record the data in a new table:

Block Label Size (1-5, 5=largest) KiloGrams (kg)

I’m deliberately constraining them at this point by doing this part of the simulation as a demonstration to keep them from dropping the blocks into the pool or changing any of the other variables. I’d ask them to reflect on what they saw: Were your predictions completely correct? How can you explain this? I’d ask them to notice the L measurement change and compare that by measuring the block on the kg scale again and compare these numbers…

Modify – Finally, I’d ask the students if their original rule needs to be changed now that they’ve seen the measurements.  Then I’d have their groups try to make a new rule explaining why each block received the measurement it did since now they see that it can’t be because of its size.

Step 3: GEM Cycle 2

Generate – To start the second cycle, I would ask students to predict what will happen when each block is dropped into the pool and explain their thinking. If they say the same thing will happen to all five blocks (ie. all sink or all float) I would not correct that at this point. I would ask them to draw what would happen on a two-column drawing one side for “prediction” the other for “actual”. I’d again ask them in their groups to write a “rule” for predicting what will happen to a block when it’s dropped into a pool of water.

Evaluate – Now, the students would stay in their groups and load the simulation themselves using the Mystery button and experimenting with dropping the blocks into the water, and drawing what actually happened beside their predictions. I’d ask them to reflect on what they saw: Were your predictions completely correct? How can you explain this?

Modify – I’d again ask the students if this original rule needs to be changed now that they’ve run the simulation and have their groups try to make a new rule explaining why each block behaved as it did when dropped into the pool and write that down. I’d ask them to record the kg of each block on the “actual” side of their diagrams and consider whether this number might be connected to what they observed in the simulation or not when they make their new rule…?

Step 4: GEM Cycle 3

Generate – At this point, I would ask students to predict what will happen when each block is dropped into the pool if the simulation is changed so that all blocks have at least one thing the same, if they all measured the same kilograms for example. I’d again ask them in their groups to write three “rules” for predicting what will happen to the blocks that are all the same (a) mass, (b) volume, and (c) density when they’re dropped into a pool of water (it’s not important that they don’t know what these terms mean, this is part of the discovery).

Evaluate – Then, the students would stay in their groups and load the simulation themselves and use the “same” x buttons to set the blocks to the same value and continue experimenting with dropping the blocks into the water. I’d ask them to reflect on what they saw and evaluate their predicted rules. I’d assign a role to one of the group members to keep a running record of “things we want to know/don’t understand” and to another as the recorder to write or draw the group predictions and rules and the actual results. At the conclusion of this part of the simulations, I’d ask them to come up with a working definition of the terms “mass”, “volume”, and density” that they’ve been observing.

Modify – I’d again ask the students if their original rules needed to be changed now that they’ve run the simulations and have their groups try to make new rules explaining why each block behaved as it did. I’d challenge them to incorporate their definitions of “mass” and “density” into their explanations.

Step 5: GEM Cycle 4

Generate – Finally, I would ask students to think about four materials that come in blocks they are familiar with: Ice, Metal, Wood, and Styrofoam. I would ask them to explain to me what would happen if I threw a block with the same mass but of each different material into the pool. (I might bring in these objects and a bowl or aquarium to help them imagine). I would then return to the Mystery simulation screen and reveal to them that the blocks in this simulation are each made of a different mystery material just like my example objects. I would ask them to generate a rule using material names for what would happen when we dropped those materials into a pool.

Evaluate – So now, the students would stay in their groups and load the simulation but go to the Custom button. I’d ask them to experiment with the different materials, their masses and volumes and explore/record/discuss what happens.

Modify – I’d ask the groups to use this information to try to identify the material of each mystery block using the data from all the simulation tabs. As an extension, I’d introduce the Buoyancy Simulation (Intro tab only) and allow them to gather information to inform their hypothesis from those materials and we’d discuss the concept of weight (N) versus mass (kg) at this point, while formally introducing the topic of the buoyant force.  Finally, we’d return to the data table from the first cycle and ask students to explain what it means that wood has a density of 0.40 kg/L while lead and gold (both metals) have a much higher density. What would happen when we drop wood into the pool versus metal? Then in the Buoyancy Playground tab of that simulation, they’d compare materials such as styrofoam, wood, or metal and craft two final truth statements (1) about gravity (N or kg) and density, (2) about density and buoyancy.

Step 6: Consolidation and Extension/Next Steps

I’d ask the groups to tweak their truth statements until they feel ready to share them with other groups, then write them on a chart paper, leaving the marker there, and go do a gallery walk to see what other groups decided. Viewers can record their affirmative or contradictory ideas and questions underneath the truth statements, from “Yes, we agree” to “What about … ?” or “But x doesn’t y so how do you explain that?” Groups would then come back together to read and reflect on the feedback, going back into the visualizations and revising their ideas as necessary. I’d have them hand in a paper copy of their two finalized statements for formative assessment.

Finally, I’d draw their attention to the bottom of both tabs in the Buoyancy Simulations where the density of the fluid within the pool can be changed and observe what happens to the blocks when the fluid is converted to “air” “gasoline” “olive oil” “water” or “honey”. A conversation about viscosity is beyond the Grade 3 curriculum but students with Gifted designations would still be able to grasp that, if not the rest of the students, especially when presented using this format.

Synthesis

Finkelstein et al. (2005) points out that “it is possible, and in the right conditions preferable, to substitute virtual equipment for real laboratory equipment” (p.6) and in this circumstance I completely agree. In the past, I have attempted to teach concepts of mass, density and the buoyant force using an actual aquarium filled with water and a variety of real objects.  There was not enough equipment to go around, a lot of watching the pushier kids do it, a lot of mess to clean up, noise to contain (I teach in an open concept building where this is an issue) and frankly, very little real learning other than comments about “how cool” that was. This simulation, particularly planned using the TGEM framework, would have accomplished real learning goals in a much more satisfying, comprehensive, and inclusive manner. Combining the TGEM framework with PhET also addresses the issue Yeo et al. (in Finkelstein, 2005) noted that timely “reflective points” should be provided to ensure students can’t just “exit a screen with alternative concepts left intact” (p.6).

It’s interesting to note the findings of Srinivassan et al. (2006) that students learning via a simulation “don’t have a sense of partaking in what they perceive as authentic experience[s]. They seem to need/want authenticity to be able to make the connections the experts make with the simulations”  [i.e. that the results of the simulation are the same as if they are using “real” items] (p.140). I wonder if my students would feel the same way? Would they be able to transfer their truth statements from the simulations above to real life problems, accurately predicting where a cube of a particular material would float in a real aquarium for example?

Admittedly, such lessons, even without the extensions, would take quite a bit of class time to navigate successfully and that is always a serious drawback in the real world of teaching. Nevertheless, when it comes to applying this to my (previous) practice, visualizing information, and applying a learning framework specifically to address a misconception, I believe it would extremely effective compared to what I’ve done in the past. Who knows, I might even see if the Grade 3 teacher would like to collaborate and run this lesson during our Library/Tech periods! 😉

Discussion

  • Have you taught these concepts in a different way or to a different age group? Are you familiar with some of the other buoyancy-esque online tools, such as BBCs InfoBits or YouTube videos, and how do you think they compare?
  • Do you think there’s a way to accomplish the learning goal while keeping the TGEM and Info-Vis lesson models without sacrificing so much class time?
  • What about summative assessment? In my opinion, it feels wrong to assess knowledge gained using simulations, visualizations, and the scientific equivalent of what Sinclair and Bruce (2015) refer to as virtual manipulatives with a pencil and paper activity/test. Can you suggest a more integrous way to assess student learning at the conclusion of this?

References

Finkelstein, N.D., Perkins, K.K., Adams, W., Kohl, P., & Podolefsky, N. (2005). When learning about the real world is better done virtually: A study of substituting computer simulations for laboratory equipment. Physics Education Research,1(1), 1-8.

Khan, S. (2007). Model-based inquiries in chemistry. Science Education, 91(6), 877-905.

Sinclair, N., & Bruce, C. D. (2015). New opportunities in geometry education at the primary school. ZDM, 47(3), 319-329.

Srinivasan, S., Perez, L. C., Palmer,R., Brooks,D., Wilson,K., & Fowler. D. (2006). Reality versus simulation. Journal of Science Education and Technology, 15(2), 137-141.

PhETs Food: Simulated Nutrition for Learning

For information visualization software to be effectively employed in the classroom, it not only needs to address a particular topic, but it also needs to be accessible and engaging in order for students to make use of it.  This is why software such as PhET is becoming so popular.  The best types of learning are active, engaging, and inquiry-based.  Not only does PhET allow opportunities for students to explore and visualize concepts, to manipulate variables, and collect data, it does so in an engaging, user-friendly and graphically enhanced manner, that is free and easily accessed.  Many times students either work with theory or real labs but have trouble connecting the two.  Simulations “scaffold students’ understanding, by focusing attention to relevant details”, (Finkelstein et al, 2005).  At times, however, students miss the value of simulations and perceive them as “fake” (Srinivasan et al, 2006), wanting only “real experiments”.  To avoid this problem, I would integrate simulations together with real labs and teacher directed learning so that they can appreciate the merits of the simulations while benefitting from their affordances.

Previously, I wrote about using PhET for optics, but I will use it for chemistry as well.  Many students struggle with chemistry, I believe, because they can’t visualize atoms, bonding or chemical reactions.  It is very hard to conceptualize how atoms interact with each other when we can’t even see them.  In my chem unit, I have students use molecular modelling kits to build simple molecules such as carbon dioxide, water and methane.  They also use them to demonstrate reactions and balancing of equations.  My students also perform various chemical reactions in “real” labs, but may have a hard time connecting these experiments with the molecular models, but see them in a separate way as single substances rather than being made of billions of atoms.  Simulations can help to bridge this gap, allowing students to see how the molecules interact with each other to form new substances.  Finkelstein et al (2005), write “properly designed simulations used in the right contexts can be more effective educational tools than real laboratory equipment”, as in this case, as students can visualize the process at the molecular level which would not be possible with lab equipment.

Lesson Topic Methodology Desired Learning Outcome
Atoms & Ions Build an Atom PhET simulation Understanding of electron orbitals, valence shells, formation of ions; Game-based assessments
Molecules Molecular model kits, Build a Molecule PhET Understanding of how electrons move to form ionic molecules, or are shared to form covalent molecules
Chemical Reactions Lab experiments; teacher instruction; student made types of reactions brochure Various atoms and molecules can react in recognizable patterns to form new substances by rearranging atoms already present
Balancing Equations Balancing Chemical Equations PhET; practice problems; Level Up balancing game When substances react, matter cannot be created or destroyed, so any atoms present before must also be present after, just rearranged

There are several PhET simulations I have or will integrate for use in this unit.  I would use the Build an Atom simulation to assess their current understandings and to reinforce their understandings of an atom, its components, and how they relate to ions, bonding, and reactions.  This simulation is ideally set up for inquiry learning and has assessment through four different games for engaging learners.  I would then use molecular model kits to have them build simple molecules and to recognize how many bonds each atom is capable of forming, so that each valence shell is filled.  After having the students perform experiments of various chemical reactions and make a brochure about the different reaction types, I would have them explore the Balancing Equations PhET.

What makes this simulation so effective is the visualization of the molecules as they balance, an immediate feedback mechanism that says if they are correct, or what the problem is, and a game with various levels to increase difficulty of the problems as they grow in understanding.  This PhET meets the standards of effective use by Stieff and Wilensky, (2003), who seek “multiple representations of concepts at multiple levels, guided exploration with immediate feedback”.  I have also created a paper game I call “Level Up” that I use in my class as well for balancing equations in a self-directed way with teacher feedback.  Using a blended approach will allow students to move away from rote memorization and repeated practice to develop conceptual approaches to problem solving while using feedback-based reasonings to justify their answers (Stieff & Wilensky, 2003).  Finally, the use of game-play and leveling up offers intrinsic rewards and incentives to motivate students to get to the next level and build on their understandings.  It has a social aspect as well, as students can assist each other in working with the simulations, work together to support understandings, or engage in friendly competition to see who can level up the fastest.

Discussion:

  1. Students sometimes perceive simulations as “fake”. How can we help students appreciate the value of simulations for visualizing concepts?
  2. How should simulations be scaffolded to maximize their effectiveness?
  3. Digital resources often serve to isolate if students work independently. How can simulations be used effectively within a learning community?


  • Finkelstein, N.D., Perkins, K.K., Adams, W., Kohl, P., & Podolefsky, N. (2005). When learning about the real world is better done virtually: A study of substituting computer simulations for laboratory equipment. Physics Education Research,1(1), 1-8. Retrieved April 02, 2012, from: http://phet.colorado.edu/web-pages/research.html.
  • Srinivasan, S., Perez, L. C., Palmer,R., Brooks,D., Wilson,K., & Fowler. D. (2006). Reality versus simulation. Journal of Science Education and Technology, 15(2), 137-141.
  • Stieff, M., & Wilensky, U. (2003). Connected chemistry – Incorporating interactive simulations into the chemistry classroom. Journal of Science Education and Technology, 12(3), 285-302.


Area and Perimeter Simulations

When implemented properly into lessons, simulations can help support student learning. It can help those students who are struggling with a given concept or who need an extra challenge. In the article, Reality versus Simulation, the authors stated that choosing activities within the student’s zone of proximal development is important. “When this type of task is presented, students will perceive themselves as competent enough to be successful and enticed enough by the learning task to sustain their attention” (Srinivasan, Perez, Palmer, Brooks, Wilson, & Fowler, 2006, p. 139). Tasks that are too challenging or too easy should be avoided. Teachers are able to identify the “just right level” of activity through proper assessments, as well as by using activities that have a range of levels. The Phet game simulations have six levels for the students to choose from that increase in difficulty. Simulations also allow students to work at their own pace and continue practicing concepts that they find difficult. In the study done by Finkelstein, Perkins, Adams, Kohl, and Podolefsky, they found that the limiting nature of simulations can actually help support the learner. This is because it prevents the students from getting distracted and therefore, they are much more likely to be productive (2005).

This week I chose to review T-Gem and apply it to a lesson on area and perimeter. When I was teaching grade three, many of my students struggled with this concept. This is usually the year that these concepts are first introduced. My goal with this lesson is for students to generate the rules of area and perimeter so that they understand it better. Far too often, students memorize formulas, without understanding them first. This doesn’t just apply to perimeter and area. For this lesson, I’ve used Phet, but I think Khan Academy or Illuminations (Scale Factor or Side Length and Area of Similar Figures) could also be used or these could be used after this lesson for students to practice.

Generate:

  • Students explore the area and perimeter Phet application, but focus only on perimeter. See if they can figure out how perimeter is calculated.
  • Next, students explore area using the Phet application. They are trying to figure out how the area is calculated.
    • Each group will try and come up with “rules” to calculate the area and perimeter of different objects. They will record these on large post-it notes around the room.
  • Students generate questions? Some examples could include
    • When do we need to measure perimeter?
    • When do we need to measure area?

Evaluate:

  • Students share their thinking with the other groups. Each group will get an opportunity to “test” the rules that each of the groups came up with.
  • Students will work on different “problems” to see if the rules work. They can use Phet for this, as well as problems that the teacher puts up for them. These can be solved on large sheets of paper.
    • Examples could include, build a rectangle with a perimeter of 15. What is the area of this shape?
    • Build a rectangle that has an area of 18 units (squared) and a perimeter of 18 units.

Modify:

  • As a class, they will discuss these different rules and come up with a rule that works (maybe more than one rule will work). They will show how they solved a problem to “prove” that a given rule works (e.g. diagram on Phet or their problem that they solved on the sheet of paper).
  • This will be done for both area and perimeter.

References:

Finkelstein, N.D., Perkins, K.K., Adams, W., Kohl, P., & Podolefsky, N. (2005). When learning about the real world is better done virtually: A study of substituting computer simulations for laboratory equipment. Physics Education Research,1(1), 1-8. Retrieved April 02, 2012, from:http://phet.colorado.edu/web-pages/research.html

PhET Interactive Simulations. (n.d.). Retrieved March 28, 2018, from https://phet.colorado.edu/en/simulations/category/math

Srinivasan, S., Perez, L. C., Palmer, R., Brooks, D., Wilson, K., & Fowler. D. (2006). Reality versus simulation. Journal of Science Education and Technology, 15(2), 137-141.

Illumination and TGEM

Stephens and Clements (2015) discuss the importance of students having sufficient background foundational knowledge before exploring and utilizing simulations. Simulations help to motivate students and create excitement, but students need to understand that there is a difference between reality and simulation which was discussed by Srinivasan et al. (2006). This lesson will be using the T-GEM framework and an interactive activity from Illuminations. Using interactive manipulatives are helpful for learners as it allows these students to work at their own pace, self-discovery and exploration. The activities can be adapted to the individual learner with the support of the teacher if needed. Further using technology allows for an engaging and interactive learning experience for students. It’s also important for student to be able to connect curriculum to real life scenarios, and technology allows students to make these connections.

https://illuminations.nctm.org/Activity.aspx?id=3510


G-Generate:

Exploration is key for students. This will allow students to ask questions they may have, and connect previous knowledge with knowledge they are gaining through self-discovery. Students will be able to practice the relationships between equivalent fractions and match each fraction to its location on the number line.

Students will use the interactive activity to explore. They will select “Build Your Own” option. Here students will be able to explore creating equivalent fractions by dividing and shading either circles or squares.

With students, go over key terminology and foundational concepts.

What are fractions?

What is a number line?

What is the numerator and what is the denominator?

What are the various ways to represent fractions?

Where do we use and see fractions in our everyday lives?

Students will generate a hypothesis regarding the relationships between fractions and how to create equivalent fractions and the relationship on the number line.

E-Evaluate:

During this stage, the teacher can pose questions that may not follow students’ hypotheses as this will allow students to evaluate the relationship. Teacher will also use equivalent fractions and have students create additional equivalent fractions.  Here, students will have to use their numeracy skills to solve these questions.

M-Modify:

Teachers will ask students to represent fractions in lowest terms. Here students will have to use their multiplication and division skills to determine this relationship and apply their knowledge. How will students use their foundational knowledge and apply it to this activity.

Questions for students:

Can all fractions be reduced to lowest terms? What are the main “benchmark” fractions?

Can one fraction have many equivalent fractions? How can you show this visually and numerically?

How does multiplication and division relate to fractions? How are number lines useful to describe fractions?


Khan, S. (2010). New pedagogies for teaching with computer simulationsJournal of Science Education and Technology, 20(3), 215-232.

Srinivasan, S., Perez, L. C., Palmer,R., Brooks,D., Wilson,K., & Fowler. D. (2006). Reality versus simulation. Journal of Science Education and Technology, 15(2), 137-141.

Stephens, A. & Clement, J. (2015). Use of physics simulations in whole class and small group settings: Comparative case studies. Computers & Education, 86, 137-156.


Info-Vis, Anchored Instruction, Game-Based Learning

Many of you have already posted wonderful lesson activities based on the technologies introduced in this module. As this is our last post, I thought it would be interesting to take a slightly different direction and generate a discussion on a more recent technology related to information visualization and anchored instruction. In module 2, we read about the “importance of having students become actively involved in the construction of knowledge” and the need to “anchor or situate instruction in the context of meaningful problem-solving environments” (Cognition and technology Group at Vanderbilt, 1992, pp. 292-294). Some schools are leveraging the interactivity of video games like Minecraft (EDU) to provide virtual learning environments for information visualization and meaningful problem-solving. Here is a quick intro to the Mindcraft EDU platform:

Microsoft acquired Minecraft EDU and re-released it to the public in November 2016. Through the platform, teachers/students can create and share immersive 3D/VR worlds that engage students in various areas including math and science. For instance, there are interactive worlds that simulate biological cells and structures, climate conditions, lunar phases, states of matter, and chemical reactions (Short, 2012). There are also worlds that challenge groups of students to work together to solve a particular problem (e.g. build a sustainable, organic farm). Here is a Minecraft world created as a visualization/simulation of a biology cell.

To date, I have not implemented Minecraft EDU in my K-12 as I am having difficulty justifying its merits. A number of questions come to mind when exploring the possibility of its implementation – here are just a couple of them for discussion:

  1. Is it worth the large investment to utilize game-based visualizations and simulations?
  2. Prensky (2003) argues that “Digital Game-Based Learning can play an important role in learning material that is not intrinsically motivating to anyone, but which needs to be learned” (p.9). Do you think game-based learning should be used strategically for less motivating content?

Cognition and Technology Group at Vanderbilt (1992b). The Jasper series as an example of anchored instruction: Theory, program, description, and assessment data. Educational Psychologist, 27(3), 291-315.

Prensky, M. (2003). Digital game-based learning. Computers in Entertainment (CIE)1(1), 21-21.

Short, D. (2012). Teaching scientific concepts using a virtual world – Minecraft. Teaching
Science, 58(3), 55-58.

Tessellations with Illuminations

I found that LfU- Learning for Use framework (Edelson, D. C. 2001) and Illuminations merged perfectly as the learner is motivated through simulations to understand the specific content or skills based on a recognition of the usefulness of that content beyond the learning environment. Moreover, Illuminations and Applets support increased motivation through tasks/lessons that are constructed and scaffolded to allow the learner to perceive themselves to be competent (Srinivasan, S. et al., 2006). As a primary teacher, I often struggle with the implementation of stimulation activities and whether it is more advantageous over real hands-on applications. For instance, using Minecraft vs. Makerspace materials to evaluate the suitability of different materials and designs for their use in a building task. Finkelstein, N.D., et al., 2005 noted that simulation does not lend itself to“mess around” and it was less restrictive compared working with real equipment. For this reason, the below lesson integrates an inquiry-based task with simulations which can be used to enhance students’ understanding of tessellations while making it learner-focused and meaningful (Edelson, D. C. 2001).

Grade 3: Geometry: Tesselations

Image source

Motivation- Western education often artificially separates learning into discrete subject areas. A First Nation, Metis, Inuit (FNMI)  believe perspective uses an integrated approach. For example, the making of a star quilt would be seen as an art involving geometry (including symmetry and rotations), an opportunity to meet a quilt maker from the community, and a way to learn cultural teachings regarding the star pattern and quilt. Quiltmaking is often a communal experience and this working with others to meet a common goal is an opportunity to explore and learn about the importance of establishing and maintaining relationships (Education, A. 2005).

Elicit Curiosity- The mayor of our city has asked us to create a Canada 150 storytelling quilt and it will be displayed at the City Hall. The challenge is to use only tessellations with a 150 Canada symbol in the middle.

Observe- Regular and Irregular Tessellations

In small groups, students are given an example of tessellations and “non-tessellations”. These varieties allow students to see that tessellations can come in multiple forms and will help avoid misconceptions. This activity allows for different perspectives and experiences to commonly discuss tessellations. The LfU (Edelson, D. C. 2001) constructivism model poses two processes that enable learners to construct understanding:

  • observation through firsthand experience, and
  • reception through communication with others.

Communicate- A tessellation is a repeating pattern of polygons that cover a plane with no gaps or overlaps. What kind of tessellations can you make out of regular polygons? https://illuminations.nctm.org/Activity.aspx?id=3533

What shapes tessellate? If shapes can be combined to make patterns that repeat and cover the plane, then they tessellate. What patterns can you find?

  • Which of the shapes tessellate by themselves? Can you cover the plane with just triangles? just squares? just pentagons?
  • Try to find a way to make a tessellation with just squares and octagons. Which other combinations of shapes tessellate?
  • Is there a way to tell if shapes can tessellate by looking at the properties of those shapes? How?

As Finkelstein, N.D., et al., 2005 stated computer-based activities:

  • Increased student access to productive concepts, and representations
  • Constrain the students in productive ways. (p. 6)

Reflect- https://calculationnation.nctm.org/Games/

By using the simulation game, teachers can examine the geometry and strategy used in the game without specifically focusing on it.  While students are playing the game, circulate the room, and ask students questions such as:

  • How are you choosing where to put your next tile?
  • Which type of tile do you like using the best?  Why?
  • Why do you think the game creators designed the game board in this way?

Once students have completed one game, have them select a tesselation then share the strategies they used for winning or playing the game.

Apply- The Exit Ticket: students generate a definition of a tessellation, in a group of four and provide each group with two images, an example and a non-example of a tessellation. The group should work together to determine which image is a tessellation and give a detailed explanation as to their answer. Be sure to have students also describe why the non-example is not a tessellation, as to clear up any misconceptions.

Extension- Finally, as a group, the students can create a Canada 150 tessellation quilt piece. Similar to the FNMI culture, this quilt making experience will bring the classroom culture together to work collaboratively making the Canada 150 quilt (tessellations) to tell a story.

I appreciated Finkelstein, N.D., et al. (2005) stating that simulations are a useful tool to promote student learning. In saying that, whether it is virtual or real equipment used to promote conceptual knowledge either learning environment should foster the development of students’ critical and reasoning skills.

I stumbled across this resource, it did not fit into this posting but I thought someone might find it helpful. Virtual Manipulatives: http://nlvm.usu.edu/en/nav/topic_t_3.html

A couple of quesitons:

  1. Will students soon expect some form a simulation activity or virtual environment in every STEM lesson?
  2. Did you believe simulations provide teachers more time to design and more freedom to assist with individualized student instruction?


Education, A. (2005). Our words, our ways: teaching First Nations, Métis and Inuit learners. Edmonton, AB: Alberta Education.

Edelson, D. C. (2001). Learning‐for‐use: A framework for the design of technology‐supported inquiry activities. Journal of Research in Science teaching, 38(3), 355-385.

Finkelstein, N.D., Perkins, K.K., Adams, W., Kohl, P., & Podolefsky, N. (2005). When learning about the real world is better done virtually: A study of substituting computer simulations for laboratory equipment. Physics Education Research,1(1), 1-8

Srinivasan, S., Perez, L. C., Palmer,R., Brooks,D., Wilson,K., & Fowler. D. (2006). Reality versus simulation. Journal of Science Education and Technology, 15 (2), 137-141

Mixed Numbers & Mixed Simulations

This week I decided to use the T-Gem model to create a lesson on mixed numbers as a way to build on students knowledge of fractions. In a fractions unit before moving onto mixed numbers students should have a strong understanding that a fraction is part of a whole. When students begin to learn about mixed numbers and improper fractions they often struggle to see what they mean conceptually as they have spent so much time learning that fractions are part of a whole.

As Stephen and Clements (2015) mention, before using any simulations students should have adequate background knowledge. Therefore, I added a simulation activity in the Evaluating Knowledge and Modifying Knowledge sections. The first activity in Generating Knowledge is a way for teachers to assess what students know already about mixed numbers and how to represent them, followed by an activity where the class can unpack what they mean together. Next is when they move to apply what they learned in the simulation activity followed by a reflection.

Srinivasan et al. (2006) discuss how simulations are compelling and can help motivate students but you cannot simply tell students that simulations are the same as real life. Students need to be able to apply their knowledge in real-life contexts as well. Therefore, to build on these activities, I would blend more simulations using programs like Mathletics and Khan Academy with hands-on materials like fraction towers, fraction circles, etc. Once students reach a strong conceptual understanding, my ideal summative tasks would involve a real-life application such as using money.

T-GEM & Mixed Numbers


References:

Srinivasan, S., Perez, L. C., Palmer,R., Brooks,D., Wilson,K., & Fowler. D. (2006). Reality versus simulation. Journal of Science Education and Technology, 15(2), 137-141.

Stephens, A. & Clement, J. (2015). Use of physics simulations in whole class and small group settings: Comparative case studies. Computers & Education, 86, 137-156.


NetLogo vs. PhET showdown

Dynamic Information Visualization

This week I chose to explore NetLogo and PhET.  Both of these are digital simulation platforms where students can explore and manipulate various simulations of scientific concepts.  Stieff and Wilensky (2003) describe a model of connected chemistry to counter the prevalent misconceptions they witness in chemistry.  While the concept is a good one, the study uses only 6 students, and they are senior undergrads or graduate students, not secondary students in a study designed to assess the effectiveness at a secondary level, so I would only view this as a preliminary study.  However, they make some good theoretical points. Traditional methods rely too much on rote memorization and rigid protocols, while connected chemistry builds understandings and reasoning to solve problems. Connected chemistry makes use of simulations to give students opportunities to make and test predictions in a controlled environment, to manipulate multiple variables to test outcomes, and to receive immediate feedback from the program.  Students must justify their conclusions using observable outcomes.

While not specifically connected chemistry, PhET could be used in a very similar fashion, though I much prefer PhET to NetLogo for a number of reasons.  NetLogo has the big advantage of more variables to manipulate, is be better at generating data for analysis, and has a lot more options in the library.  On the other hand, PhET has much better graphics, better visualization and engagement, and a friendlier user interface.  So many of the NetLogo simulations seem similar, and are based on statistics.  While they may be more useful for post-secondary or research, I think my secondary students would find them confusing and boring.    PhET has a broader range of type and style of simulations and engages students better.  The circuit building app is a great example of what is best in simulations.

Figure 1: Circuit Builder from PhET, Simple Kinetics from NetLogo

Finkelstein et al, (2005), performed an experiment comparing student mastery of circuits when taught through simulations or hands-on labs.  This was a much more rigorous study than Stieff and Wilensky, assessing the progress of multiple groups or classes of students through a electricity unit. Not only did students working with the circuit simulation demonstrate a better mastery of the concepts, but surprisingly, they were also more proficient at constructing and discussing real circuits than those working with lab materials.

Many people argue that the biggest benefit of simulations is the cost, but I would argue that it is TIME.  Simulations allow students to run multiple simulations in a very short time, and to manipulate many more variables than students working with lab equipment would be able to in the same time.  This repeated experiment not only reinforces understandings better but gives more opportunity for exploration and inquiry.  This is not to say that simulations are always better.  Srinivasan et al (2006), note an unexpected finding, that while researchers could appreciate their merit, students perceived simulations to be fake, cheap copies of the real thing. It depends on the pedagogy of their use and the quality of their design. This is why I prefer PhET for my classes. “Properly designed simulations used in the right contexts can be more effective educational tools than real laboratory equipment”, (Finkelstein et al, 2005).

For Discussion:

  1. How important is graphic design for effective simulations?
  2. Evaluate the statement that the biggest benefit of simulations is time.
  3. What are the most important elements of effective simulations for the elementary or secondary levels?


  • Finkelstein, N.D., Perkins, K.K., Adams, W., Kohl, P., & Podolefsky, N. (2005). When learning about the real world is better done virtually: A study of substituting computer simulations for laboratory equipment. Physics Education Research,1(1), 1-8. Retrieved April 02, 2012, from: http://phet.colorado.edu/web-pages/research.html.
  • Srinivasan, S., Perez, L. C., Palmer,R., Brooks,D., Wilson,K., & Fowler. D. (2006). Reality versus simulation. Journal of Science Education and Technology, 15(2), 137-141.
  • Stieff, M., & Wilensky, U. (2003). Connected chemistry – Incorporating interactive simulations into the chemistry classroom. Journal of Science Education and Technology, 12(3), 285-302.

Mental Math T-GEM

My posting for this week involves the T-GEM cycle and the interactive “Make a Ten” activity from PhET. I believe this would be particularly helpful in the lower elementary classroom, as the way in which the visualization is organized, and the speed in which one can manipulate numbers makes it ideal and quicker to use than traditional manipulative tools. This simulation shows an example of how “…computers might be the best educational option for our students” (Finkelstein et al., 2005), using layering of numbers and essentially makes it an online and more improved/technology integrated version of the Numicon tools. Essentially, it provides a model-based inquiry for math manipulatives, but it’s responsiveness works much faster than using the physical pieces. While the articles I read closely this week were more geared towards the sciences, I found that much of the content could be applied to this mathematics simulation as well, as it deals with pattern detecting and creating rules. Xiang and Passmore write, “There has been increased recognition in the past decades that model-based inquiry (MBI) is a promising approach for cultivating deep understandings by helping students unite phenomena and underlying mechanisms” (Xiang & Passmore 2015), which I think applies to this tool.

Here’s the link to the simulation.

Generate:

  • Students explore and play around with the simulation. Then, they look for as many different ways as they can make equation or number sentence for two numbers that have a sum of 10. Then 15. Then 20. Then 50.
  • Students collect information about numbers and the patterns then can detect individually.

Evaluate:

  • Students are grouped into threes and discuss their findings with their classmates. Collectively, they turn those patterns into relationships and rules for mental maths strategies.
  • Students collate their rules and move around the class to have a look at how many of their rules match up with others in the classroom. Students take note of rules that looked different from their own.

Modify:

  • Students review and test out each others’ rules, making room for comments and being ready to explain their thinking.
  • Students go through the cycle again, assessing their strategies with subtraction, and looking for commonalities

As Finkelstein et al. write, “We do not suggest that simulations necessarily promote conceptual learning nor do they ensure facility with real equipment, but rather computer simulations that are properly designed are useful tools for a variety of contexts that can promote student learning” (Finkelstein et al., 2005). This tool is one such simulation that enhances student learning.

References:

Xiang, L., & Passmore, C. (2015). A framework for model-based inquiry through agent-based programming. Journal of Science Education and Technology, 24(2-3), 311-329.

Finkelstein, N.D., Perkins, K.K., Adams, W., Kohl, P., & Podolefsky, N. (2005). When learning about the real world is better done virtually: A study of substituting computer simulations for laboratory equipment. Physics Education Research,1(1), 1-8.

Primary Geometry Lesson

Srinivasan, et al. (2006) describe the learning process as described by the learner’s prior knowledge, ability and motivation.  The amount of load placed upon the students working memory by a learning task, “cognitive load”, enhances or diminishes their individual learning experience.  Not only do educators need to account for this appropriate cognitive load, they are also searching for effective tools to motivate students.  Some of the factors influencing student motivation include: challenge, fantasy, curiosity, novelty, interest, and importance/value.  Additionally, educators search and explore digital technologies and/or virtual simulation to further enhance the learning experience.  As described by Finkelstein, et al. (2005), these digital tools provide visual representations of hidden concepts.  Effective digital tools/simulations are designed to be highly interaction, engaging, highly visual, build explicit bridges between students’ everyday understand of the world and its underlying physical principles, and make physical models visible.

The below unit plan takes Sinclair and Bruce’s (2015) findings that “students perform quite poorly on a wide range of geometry tasks” (p. 319).  They found that almost every country based their primary school geometry curriculum on the study of two-dimensional shapes.  They reason that educators fail to see that geometry provides the basic meanings of mathematics: representations, models, visualizations, analogies and physical materials).  Incorporating the digital, social, inquiry and visual nature of each of the instructional frameworks from Module B, my goal is to create a unit that is engaging and motivates my students with playful tasks and exploratory lessons.


Topic: 3-D Geometric Shapes

Grade: 2


Motivation/Hook: Accessing previous knowledge

  • While holding up models of a 3-D shape:
    • What does this shape remind you of?
    • What shapes do you see?
    • How are they connected?
  • Scavenger hunt: Can each table group please find me two items in the classroom that has this shape? How did you know these were the same?


Familiarity:

  • In pairs ask students to group the shapes without providing any criteria for alike shapes.
    • Why did you choose these groups?
    • How are these similar or different?


Teacher Guidance:

  • Introduction of edges, faces and vertices (shape attributes)
  • During group discussion, provide each student with the shape for students to twist and manipulate (visual and kinetic interaction)


Technology Integration: Virtual Manipulation

  • Example tools provided by Sinclair & Bruce (2015)
    • Kidpix, Piece Puzzler, Geometer’s Sketchpad, Cabri-geometre
  • Shape manipulation through tough screen and dragging
    • Is it the same shape if a stretch it? What if I rotate it?

Research has indicated that young students are more creative and create more complex and prolific patterns when using virtual manipulation than when using concrete materials.  This may be because the shapes can be snapped into position and stay fixed (you can stack to spheres on top of each other without them falling over) (Sinclair & Bruce (2015).


Applying Understanding

  • Students use the above tools to design and create a 3-D character or object
    • Why did you choose these shapes? How would these shapes stay together?  What different sizes did you choose?
  • 3-D printer to bring their vision to life (aided by an older buddy class).


Finkelstein, N. D., Adams, W. K., Keller, C.J., Kohl, P.B., Perkins, K. K., Podolefsky, N. S. & Reid, S. (2005). When learning about the real world is better done virtually: a study of substituting computer simulations for laboratory equipment. Physical Education Research. 1(1), 1-7.


Sinclair, N. & Bruce, C. (2015). New opportunities in geometry education at the primary school. ZDM Mathematics Education. 47(1), 319-329.


Srinivasan, S., Perez, L., Palmer, R., Brooks, D., Wilson, K. & Fowler, D. (2006). Reality versus Simulation. Journal of Science Education and Technology. 15(2), 137-140.