Comparing Housing Affordability in Metro Vancouver and Ottawa
What are the different methods of classification and how can they be applied to real life usages?
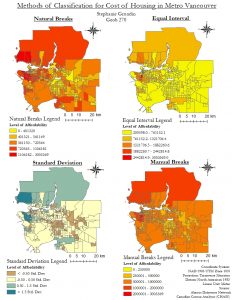
Methods of Classification for Cost of Housing in Metro Vancouver
- Natural Breaks : Classes are based on natural groupings inherent in the data. Not useful in comparing maps as they are built from different underlying information.
- Equal Interval : Divides the range of attribute values into equal-sized subranges.
- Standard Deviation : How much a feature’s attribute value varies from the mean.
- Manual Breaks : Manually add class breaks and set class ranges.
If I were a journalist, I would want to argue in my article that Vancouver is becoming an increasingly unaffordable city to live in, and to prove my argument I would back it up spatial evidence. I would use the manual breaks classification map in my article as I am able to set class ranges and add class breaks to suit my purpose in ArcGIS. The class ranges set into Manual Breaks has very few census tracts that are in the affordable category and it visualizes Metro Vancouver as severely unaffordable. Ethical implications would include how I am able to manipulate data to further support my statement in my article.
If I were a real estate agent presenting to prospective home buyers around UBC, I would select Equal Interval to present the data to buyers. The reason for this is because in Equal Interval the range of attribute values are divided into equal sized subranges. This presents the UBC and Point Grey region in the most affordable category, whereas in the other data classifications the UBC region is presented as severely unaffordable. This would appear to buyers that the region is more affordable and will be within their budget to purchase a home, thus increasing the likelihood they will purchase and my real estate company would greatly benefit. Ethical implications would include the buyers do not visually see how much UBC properties deviate from the standard, therefore not knowing how expensive these properties actually are.
Questions on Affordability in the City
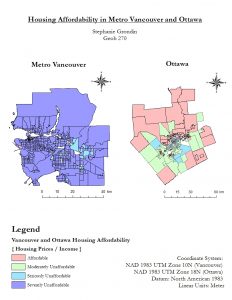 Comparing Housing Affordability in Vancouver and Ottawa
1) What is affordability measuring, and why is it a better indicator of housing affordability than housing cost alone?
Housing Affordability is a measure of the cost of housing normalized by the household income. It is a better indicator of affordability compared to the cost of the house alone, as household income varies to each city and region, whereas the cost of the house alone only represents the building and land value. Even though house pricing can reach a cost of over a million dollars, if the buyers are earning a higher income, than the house appears affordable to them compared to a low income family.
2) What are the housing affordability rating categories? Who determined them and are they to be ‘trusted’? (You have seen in the previous map how different classification breaks produce very different visual impressions).
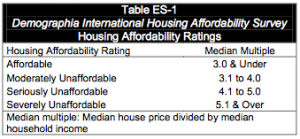
Table 1 – Housing Affordability Ratings
The housing affordability rating categories are based by the “Median Multiple : Median House Price Divided by Median Household Income”, determined by the Demographia International Housing Affordability Survey. The rating is separated into 4 categories: Affordable (3.0 & under), Moderately Unaffordable (3.1 – 4.0), Seriously Unaffordable (4.1 – 5.0), Severely Unaffordable (5.1 & over). The rating system is widely used in Urban Markets, including the World Bank, United Nations, and the Joint Centre for Housing Studies, Harvard University. I believe the values can be trusted, as the median housing income is used, meaning 50% of the incomes in that census tract are above this value and 50% are below.
3) Is affordability a good indicator of a city’s ‘livability’?
A city’s livability is the sum of the factors that add up to a quality of life. This includes the built and natural environments, economic prosperity, social stability, educational opportunity, and cultural, entertainment and recreation possibilities. Affordability is only one factor out of these indicators that measure up to a city’s livability. Even though Vancouver is severely unaffordable, it does not rule out the city is not livable. It seems that despite a lot of resident’s income goes into housing, they still manage to maintain a high quality of life in Vancouver. Housing affordability does play a part of the sum of factors that goes into deciding if a city is livable, but it is not the sole indicator of a city’s livability.