Choropleth Map of Vancouver
 Population of English and French Speakers in the City of Vancouver
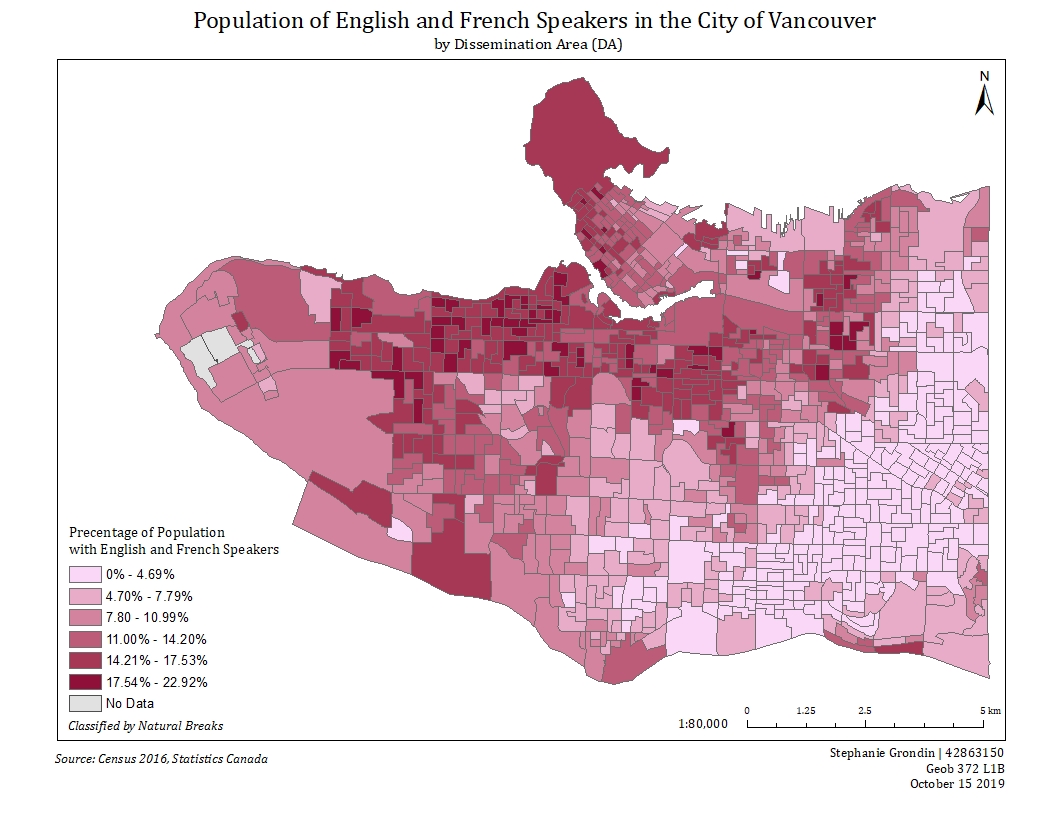
Creating a Choropleth Map in ArcGIS
For this lab I was tasked to create a choropleth map of the City of Vancouver using Canadian Census data from 2016 for the audience of my choice. The target audience for my map is a Vancouver Global Exchange company partnered with France to find students hosts homes with English and French speaking hosts in Vancouver. I selected the English and French speaking variable, and I normalized the variable to population to inform the audience the percent of the population that speaks both English and French in Vancouver. I used natural breaks with 6 classes to deal with the 1 outlier on the extreme max, otherwise it would have grouped a few more dissemination areas in the extreme category with the outlier.
What I learned:
- Learned how to download and use Canadian Census data in ArcGIS.
- Cannot use raw data for choropleth maps, must be standardized.
- It is important to pick the right classification scheme, otherwise data can be interpreted and understood in a different way.
Improvements for the future (takeaways):
- Don’t rush and forget any map elements, such as forgetting to indicate your map projection under Source…