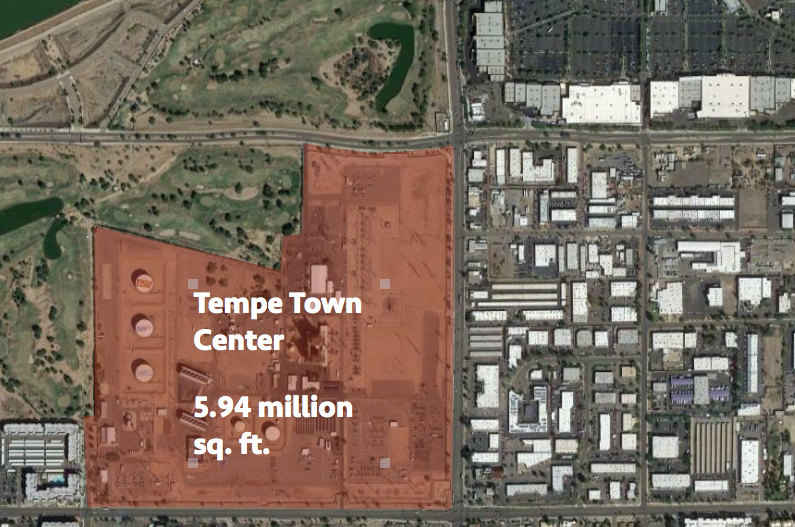
For my final project in GEOB 270, I worked on a team of four to address a current city planning problem in Phoenix, Arizona. As a hockey fan, I learned that as of March 8th, the NHL was becoming impatient with PPP negotiations between the franchise and the City of Glendale. Historically, the franchise has been marked by low demand and losses, leading to their 2009 bankruptcy. They signed a 2-year, $15 million agreement with Glendale in 2015, but that contract has expired and the Coyotes are looking elsewhere to build a new arena closer to their East Valley fanbase. A deal with Arizona State University fell through in February 2017, which would have seen the arena located at the Tempe Town Center.
Our team reasoned that it would be beneficial to locate a new arena within Phoenix city limits to accommodate both East and West Valley fans. Using the failed Tempe Town Center site as a reference for parcel size, our goal was to use GIS analysis to narrow down three potential sites for a new arena.

As a team, we decided to all participate in sourcing the data, which was the most time-consuming task out of the entire project. We brainstormed what our criteria for the arena would be and then searched for Arizona open data together. After we had assessed the reliability, metadata, and accuracy of our data, we moved into the spatial analysis stage. Each member handled one specific stage according to our criteria: driveability (me), walkability (Kanchi), natural hazards (Templar), and zoning/parcels (Wasinee). From this point, we collectively worked on the weighted overlay and visual inspection, which were arguably the most difficult parts of the project as we ventured beyond class. For a full illustration of our procedure, see our project flowchart.
What we learned:
- From the final three locations, we determined only one to be suitable for an NHL arena; our final site was located outside of a floodzone, across the street from a hospital, close to a variety of parking lots, and beside three freeway interchanges and several bus stops. Moreover, it was determined to be in a light industrial zone and in close proximity to a shopping centre, located in the Desert Ridge neighbourhood of Phoenix.

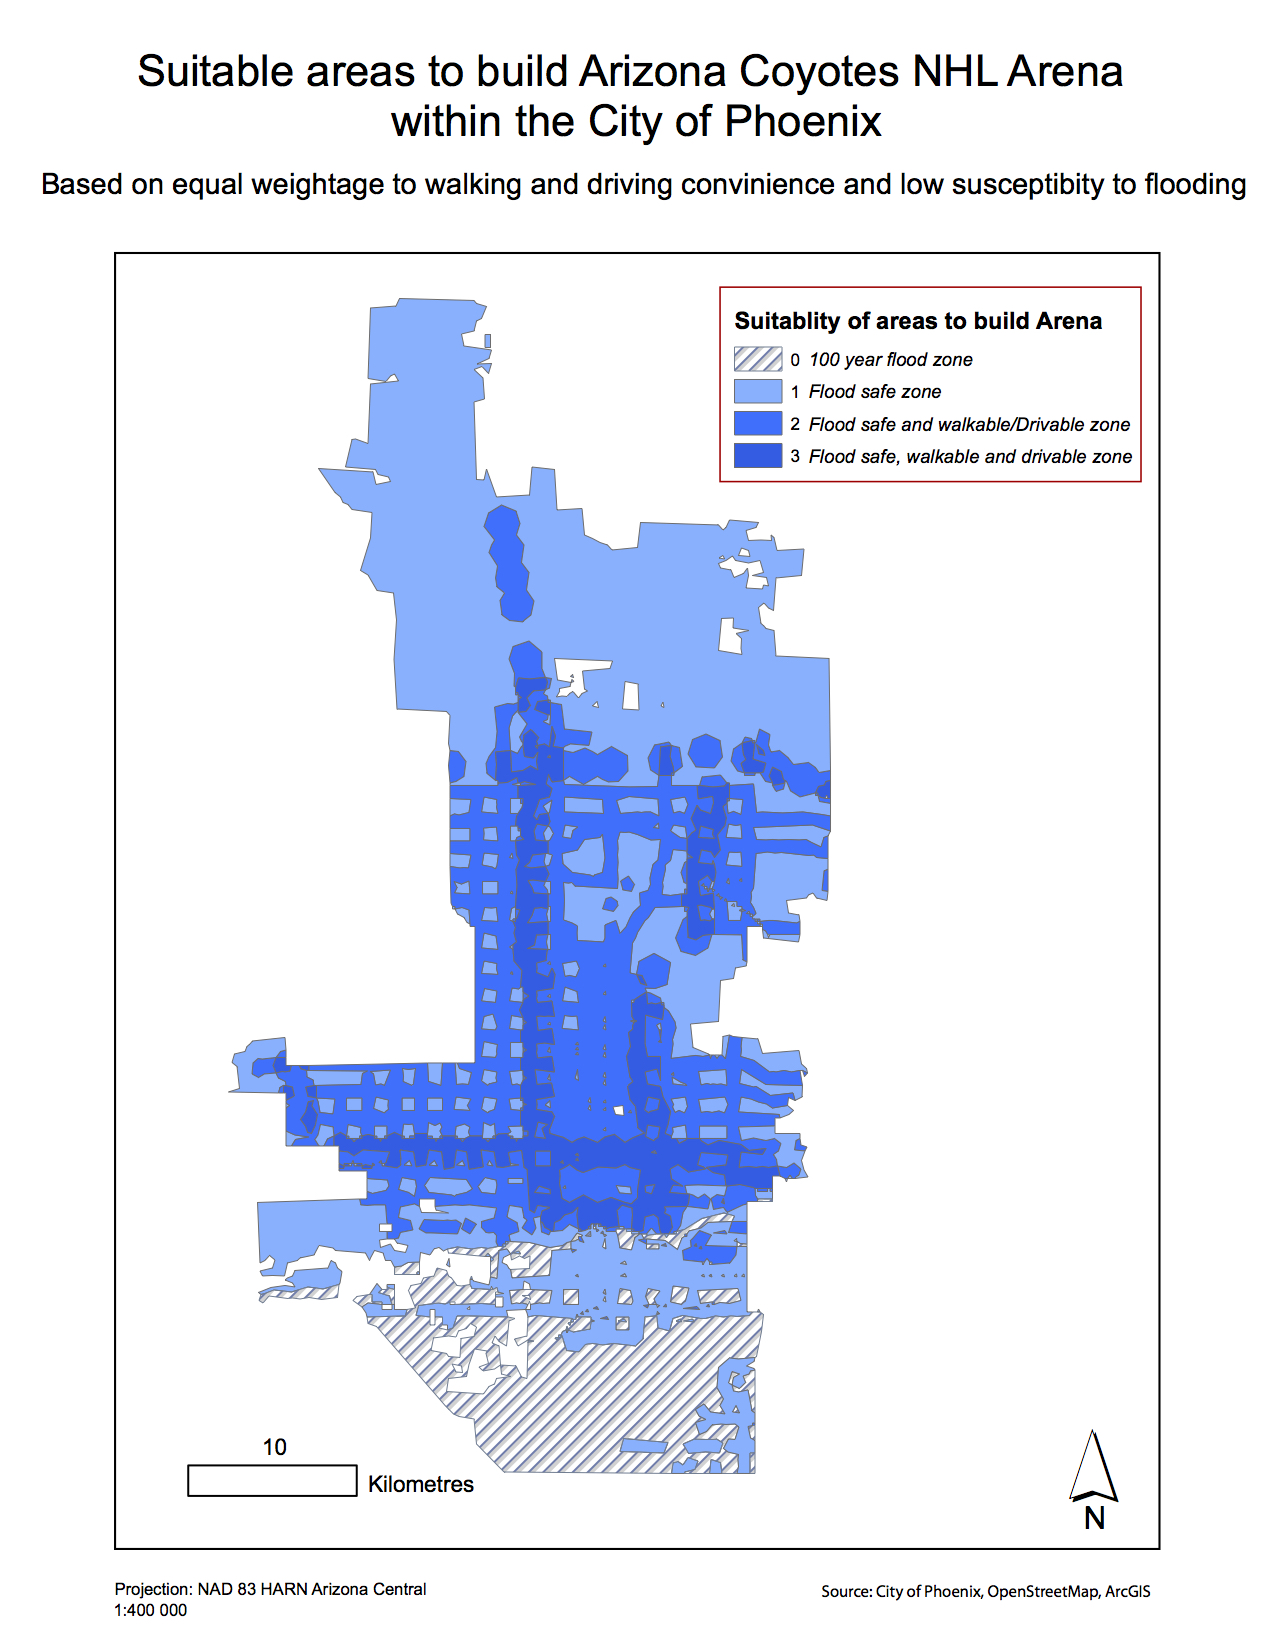
- The raster calculator tool reclassified three different raster layers and assigned to them a number, 1, 2, or 3, to show spatially where three of our criteria layers aligned (see Map 2). We then located parcels within areas given a ‘3’ to find suitable sites. We originally planned to use the weighted overlay tool but decided that it was outside the scope of this project, and would require proper statistical weighting methods.

- Data management is difficult while working with three people, as ArcGIS cannot be edited simultaneously like Google Applications. To combat this, we decided to openly access one member’s account, and then work on different map documents from the same geodatabase to perform our respective tasks. When completed, we met together to work on one map document for the final inspection and map.
- We ran into issues trying to find cost data; we realized that it isn’t very accessible to find tabular cost data that can be joined to an ArcGIS shapefile. Though we found parcel assessments on arcgis.com, they were in PDF format and unable to be used for spatial analysis. We also realized, near the end, that the site on which we chose to base our parcel sizing was different than the Coyotes originally announced.
Altogether, the project was exhilirating, took long hours, and required much attention to detail and strong knowledge of ArcGIS features. See here for the final report.

 Follow


