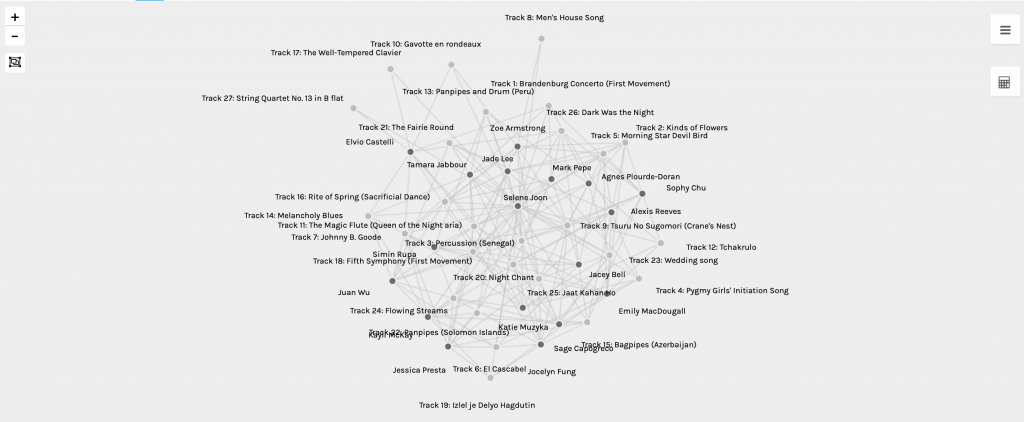
This fantastic graphic indicates how our music selections could be interrelated. The data reflects information technology could be positively involved in one’s assumption. At the same time, understanding various individuals’ preferences could enhance one’s intellectual growth.
Using these visualizations as prompts, reflect on the political implications of such groupings considering what data is missing, assumed, or misinterpreted.
Each individual’s music selection could be very different, and everyone’s intention could be relatively diverse. The graphic or data simply illustrates an individual’s personal preferences or personal music taste based on different moods. However, no further explanations or in-depth analyses were provided for others to investigate. At the same time, the data could provide more information based on the age group of individuals and cultural references to connect with music selection reasons.
While you may be able to justify your musical choices in the Quiz, there also may exist reasons why you did not choose other pieces. Can the reasons for these “null” choices ever be reflected/interpreted in the data?
The rationale of this music selection graphic could vary for many reasons. The data perhaps could add other visuals or videos to connect the selection. For example, ones could add another photo to represent the mood change when hearing different songs and the emotions were selecting the preferred music. Therefore, it is difficult for individuals to reflect on data for any “null” choices.