Before defining weight of each criterion, we need to modify our data based on our final goal——-Which part in district of north Vancouver has the largest possibility of having storm water.
So two criteria need to be changed due to the subsequent process: Elevation and slope.
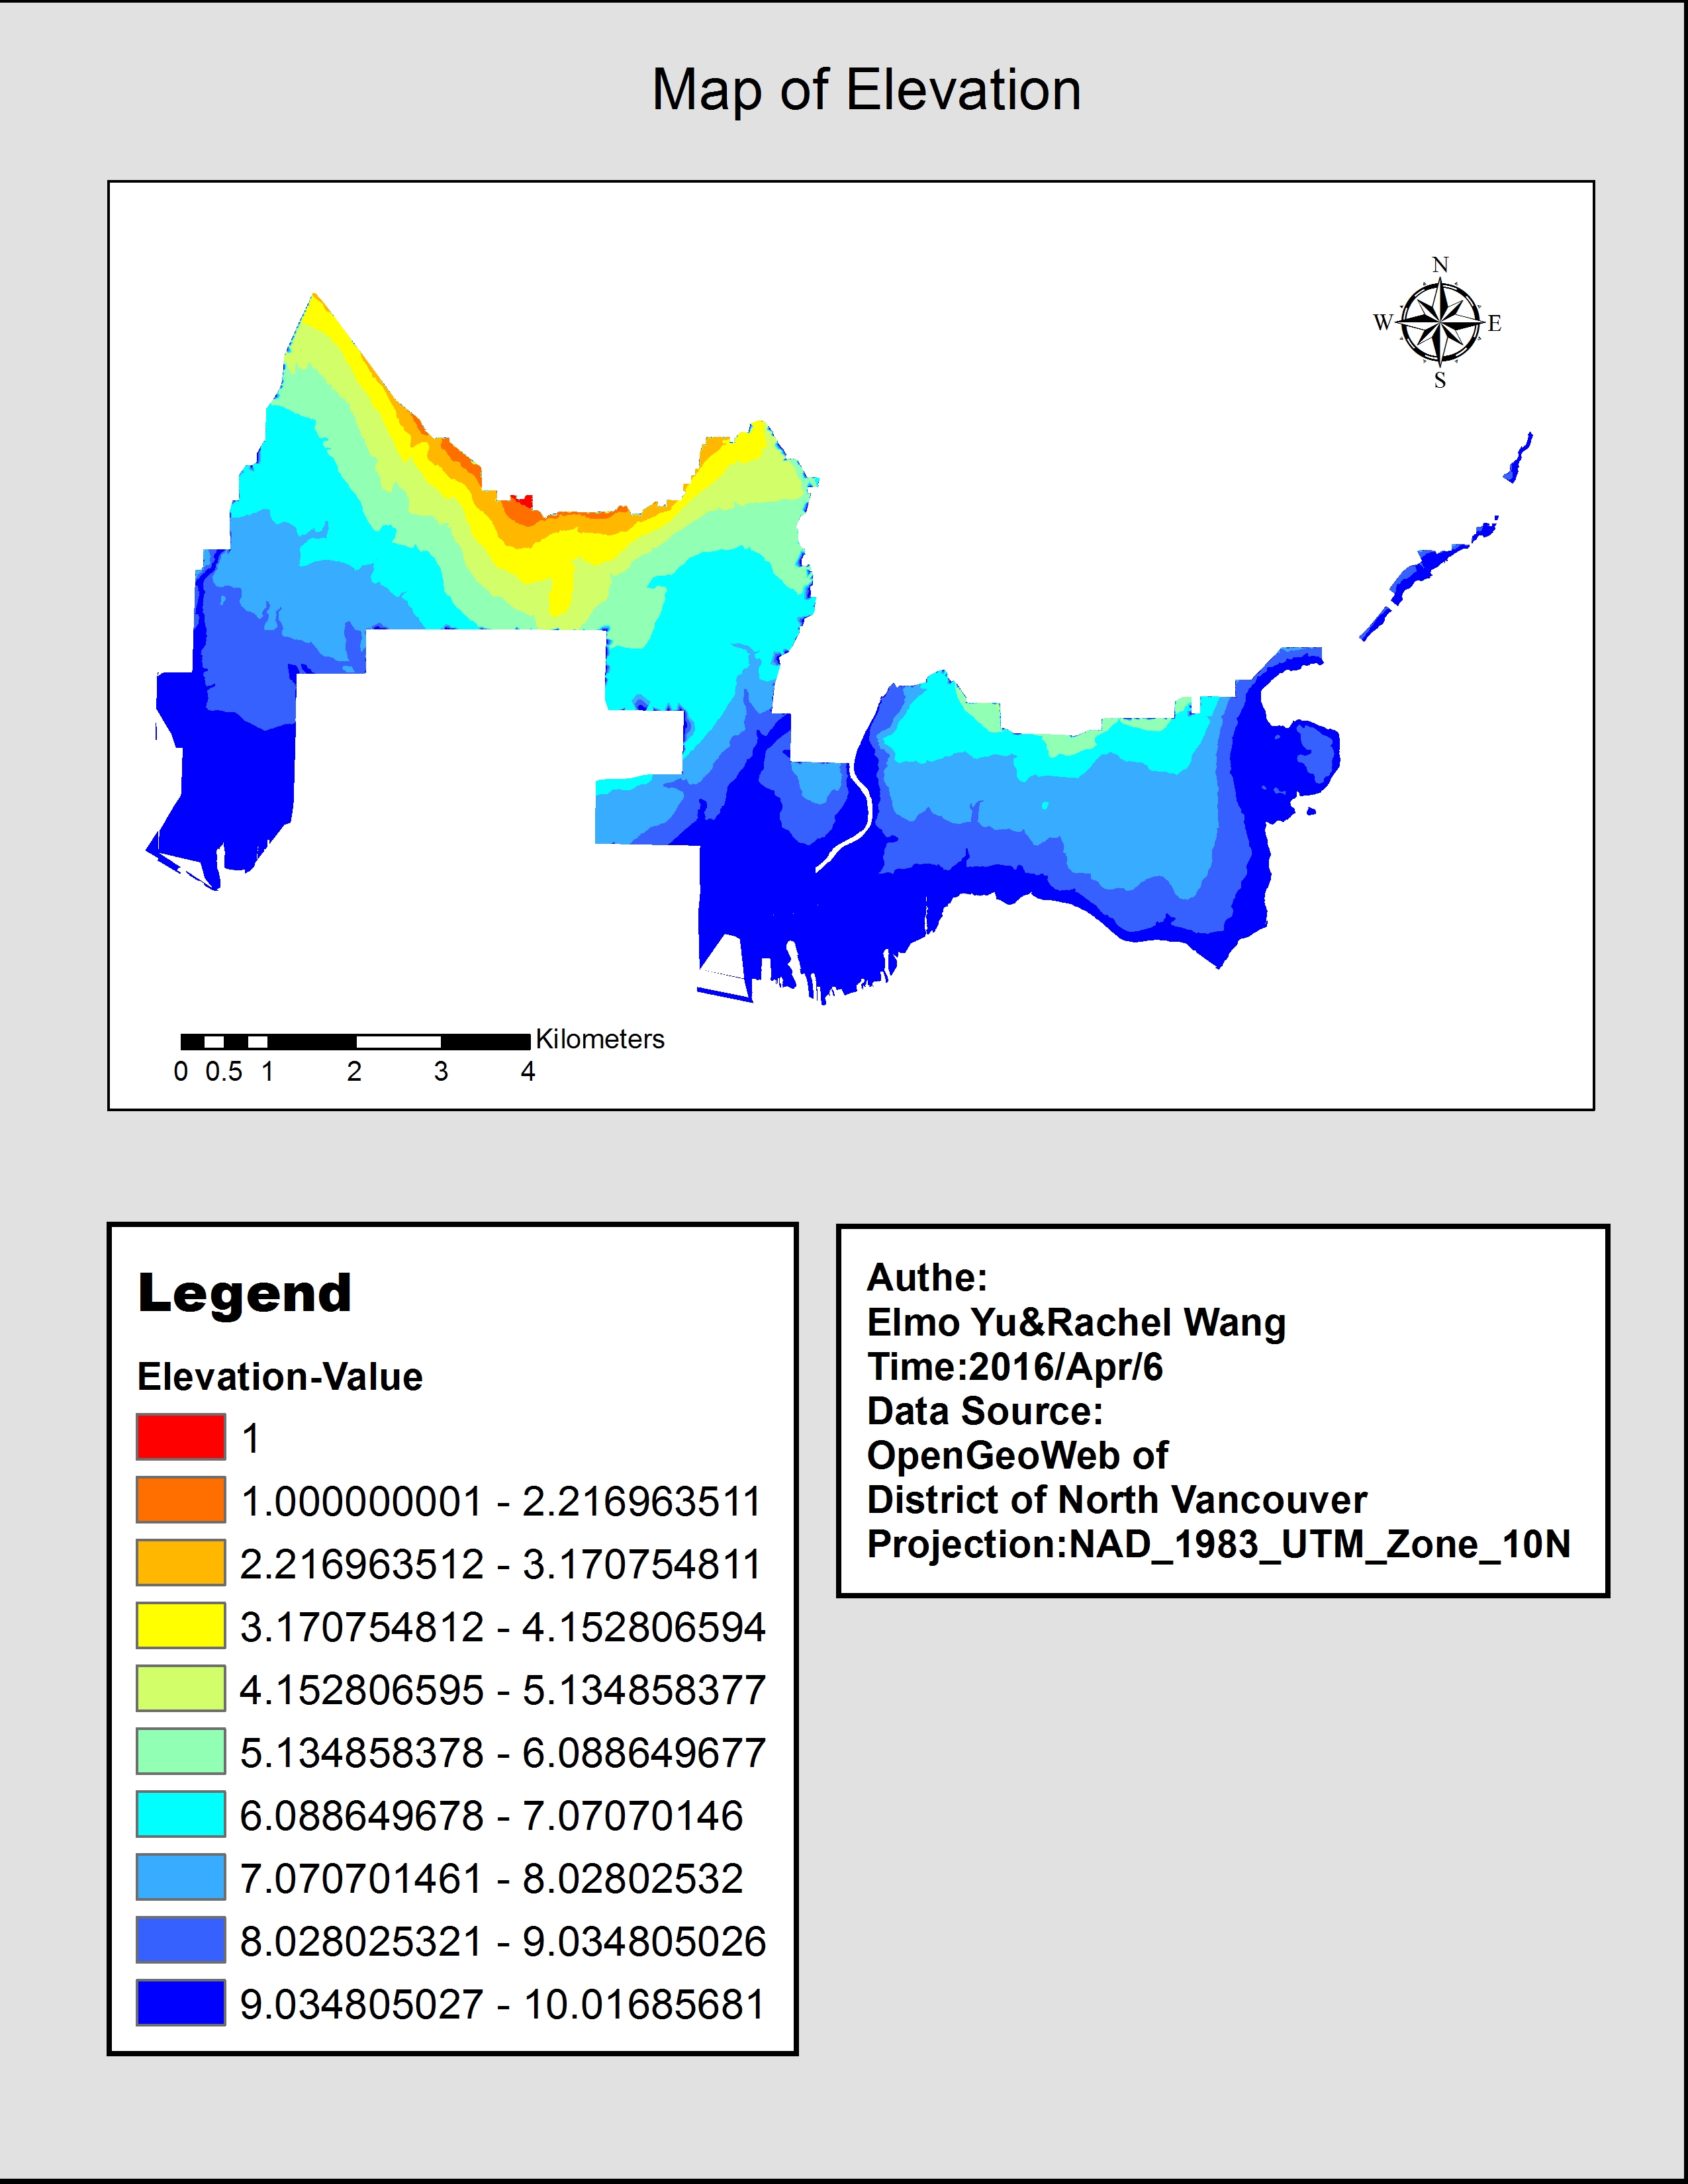
Elevation
What we have in our data set is the data of contour line with 5 meters’ interval. The processing sequence will be:
Contour Lines→TIN→Raster→Clip by domain→categorize value to ten categories(same interval)→ reclassify values
In the reclassifying part, categorized value will be given number from 1 to 10 and the relationship between old value and new ones will be invert, which means the category with largest value will be assigned by 1 and the smallest category will be given the value of 10.
The reason of doing this invert reclassification is based on the possibility of storm water occurring because water always flow downhill. The result is shown below, the red part is the highest while the dark blue part is of the lowest elevation:
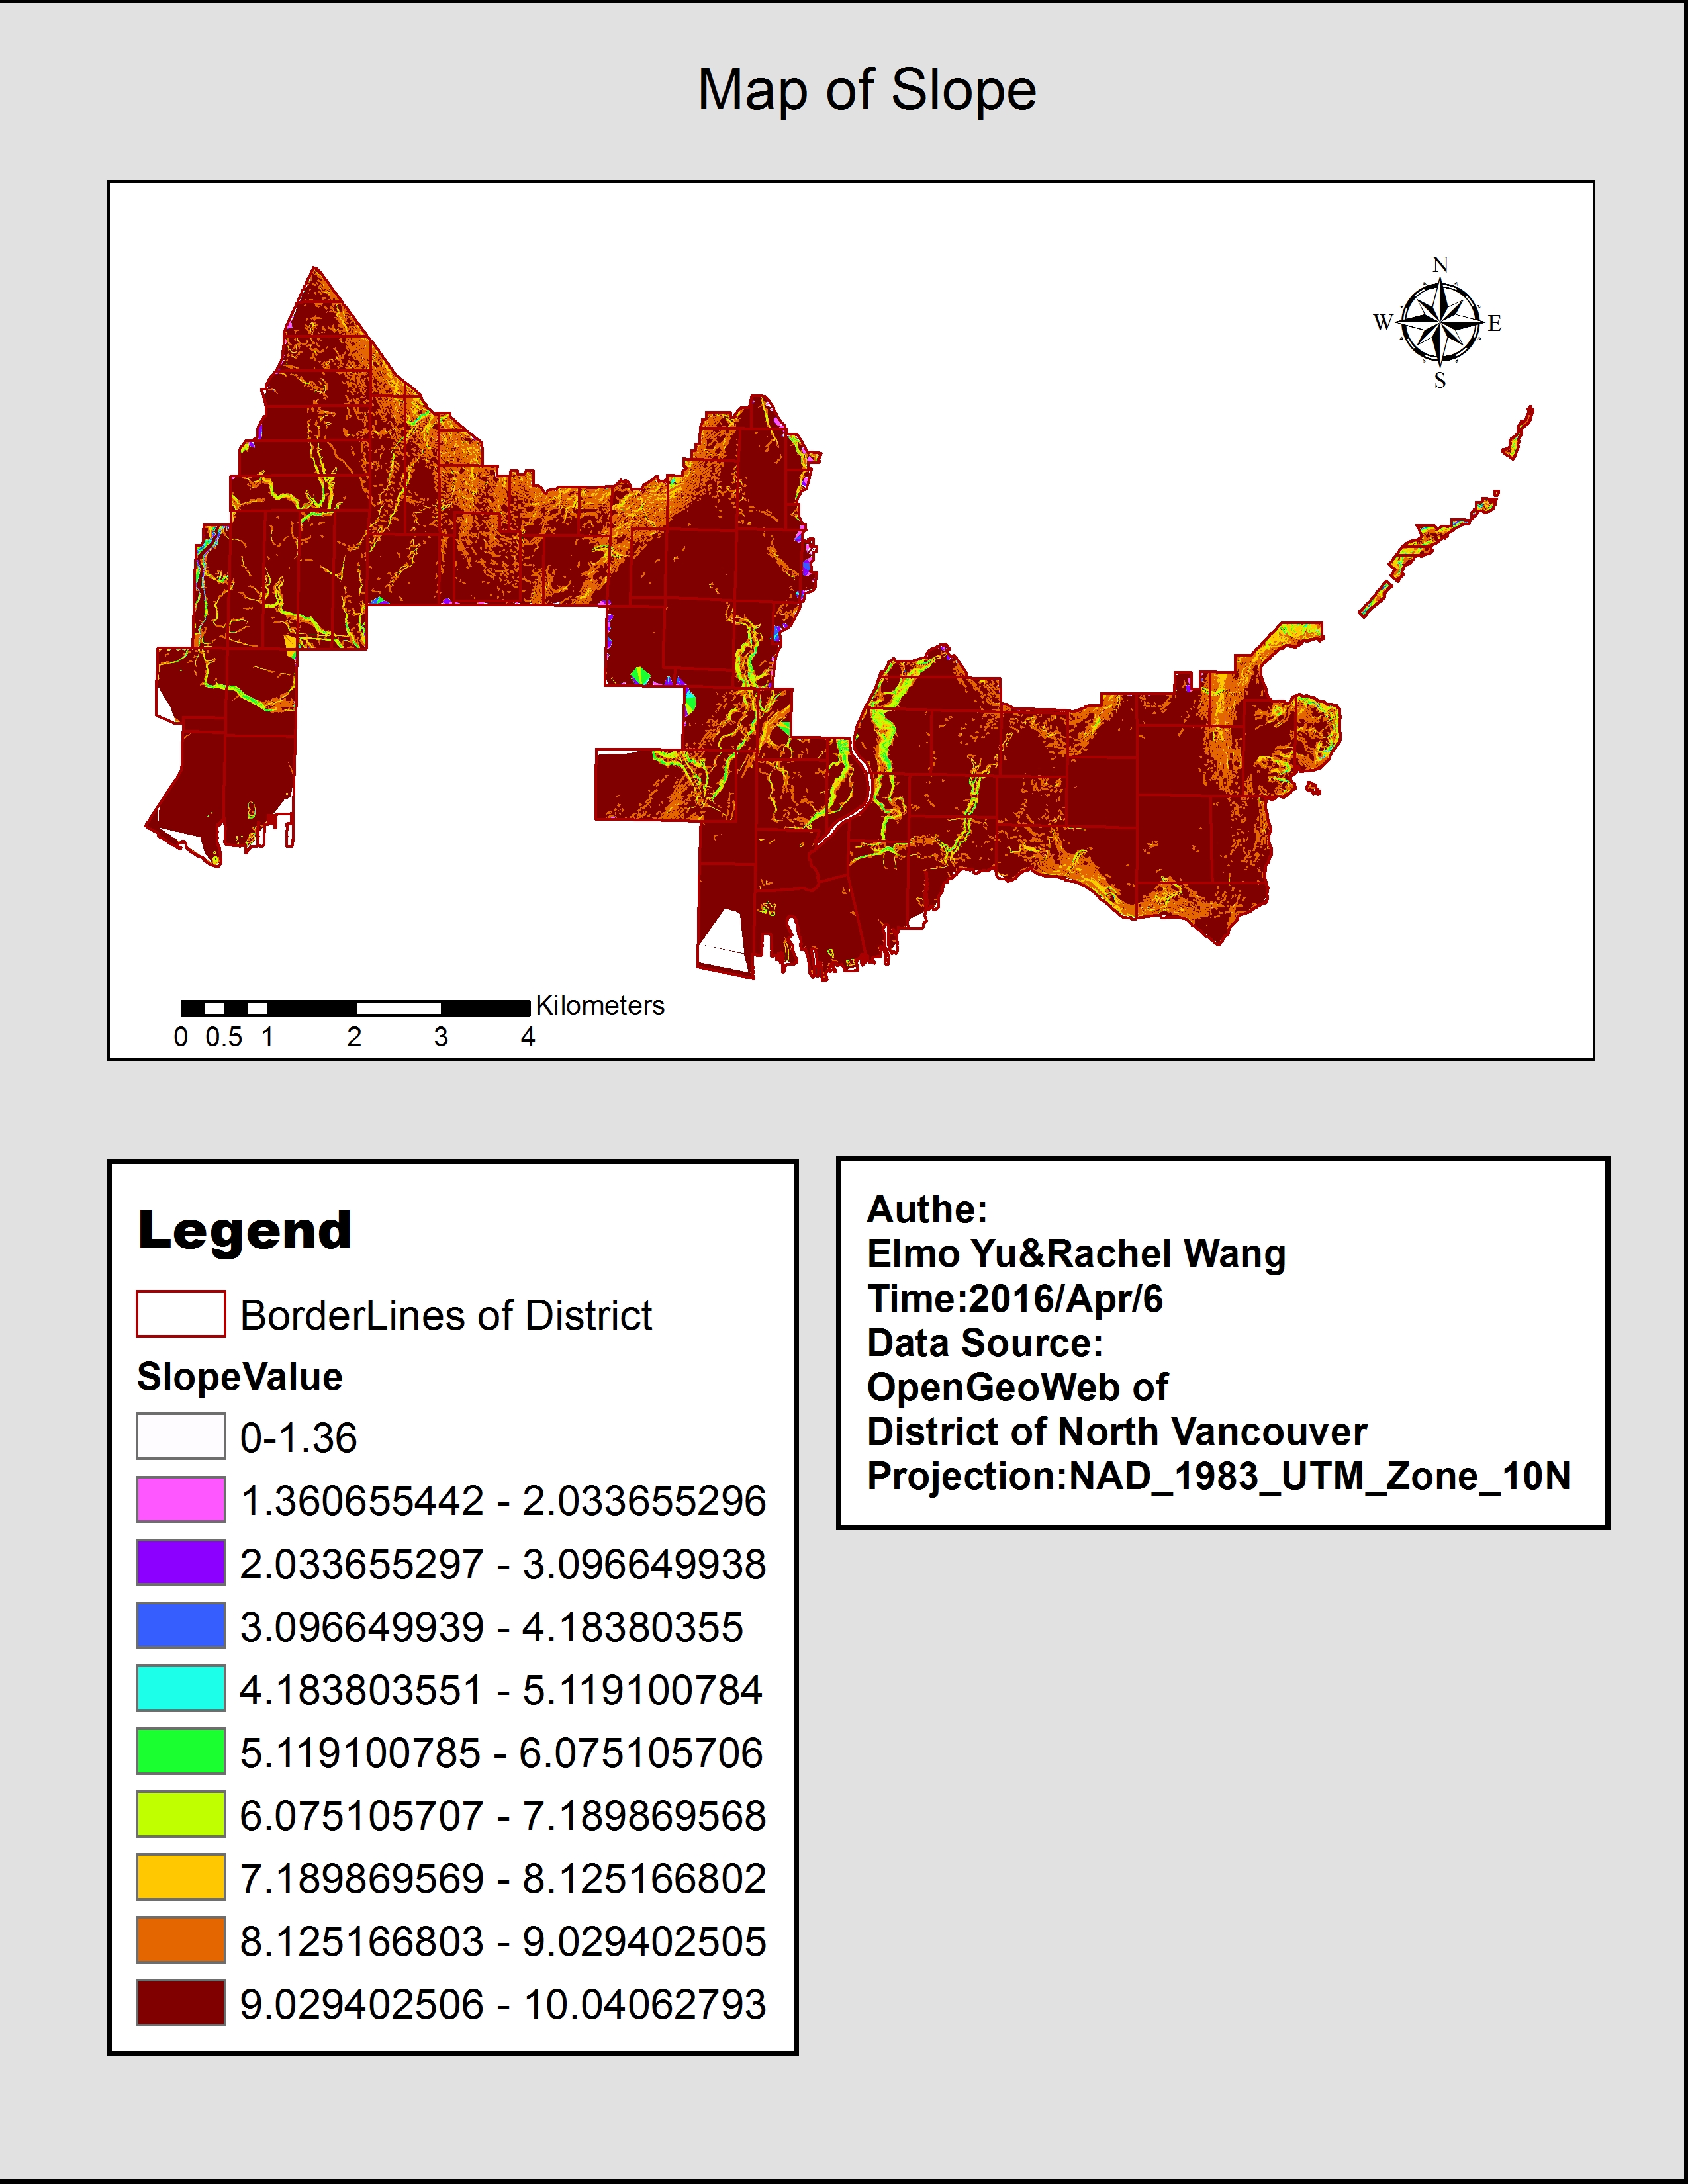
Slope
Since we have get the elevation raster, it’s easy to get slope layer. What we need to do is the same thing that we do in Elevation as the flatter the surface is, the more water it will keep. Result is followed, the pink and purple parts are the most steep while the brown parts are the most flat: