There are no other countries that are more dependent on fishery than Iceland. Due to its geographic superiority, lcelanders have been enjoying the ocean and living on fish for two hundred years. And thanks to its efficient fishery management system, Iceland is able to maintain an optimal fish stock as well as encourage the innovation in fishing technology. Interestingly, Iceland was not known for its prosperous fishery for centuries, rather, it was known by the world in 2008, when the global financial crisis gave the fishermen a critical strike and the country almost went bankrupt. It seems that it is time for Icelanders to invest in fish stock instead of money stock.
Introduction to Icelandic fishery
Iceland is the second largest island in Europe. Located beside the junction of East Greenland Current from the north and Irminger Current from the south, Iceland enjoys a flourishing fish stock in Icelandic water. Among its abundant and various ecosystem, there are about 25 species that have commercial importance and only a handful dominate the catches.[1] Main species include Cod, Haddock, Saithe, Redfish, Atlantic catfish and Greenland halibut, with cod products accounting for 35-40% of the total seafood export revenue.[2] During the catching seasons from January to October each year, total catches in Icelandic waters fluctuate between 1 and 2 million tonnes annually since late 1970s.[3] The export of fish products plays such an important role in Iceland economy that it makes up 41% of merchandise exports, 26% of total exports and 10.5% of GDP in 2011.[4]
Policy development
Iceland has a long history of fishery management starting from 1901 but it was not until 1976 that fishery policy really came onto the table. Fishery policy development can be divided into four major periods. First period is 1976-1983, when total allowable catch (TAC) was first introduced in 1976 because of the scientific concern of the spawning stock. A TAC of 230,000 MT was introduced and the fishing days were limited to 215 days per year. The second period is 1984, when a system of individual vessel quotas with some transfer rights were introduced, which covered Cod, Haddock, Saithe, Redfish, Greenland halibut, Plaice and ocean catfish. The third period is 1985-1990 when effort based option was introduced for those that preferred it. Yet, fishery management was not efficient in this period since there was friction between effort based fishing and quotas based fishing. Finally in 1990, the individual transferable quotas (ITQ) system was established for most of the commercial fisheries, which were all subject to vessel catch quotas instead of effort based fishing. The quotas, representing shares in TAC, are permanent, perfectly divisible and fairly freely transferable.[5]Iceland has experience of almost all the fishery policies, such as aggregate quotas, limits on catch effort and individual transferable quotas. After all the experiment, individual transferable quotas was proved to be the most efficient one. Since its establishment in 1990, there has been more control on the catches, which results in a sustainable development of the fishery.
Individual Transferable Quotas (ITQ)
The individual transferable quotas system is proved to be the most efficient system by the Icelanders. In the past 20 years, cod stocks were fluctuating around 200,000 tonnes, haddock and saithe stocks were fluctuating around 50,000 tonnes and demersal redfish stocks were around 50,000 tonnes.[6] There are some highlights of the Icelandic ITQ:[7]
- The total allowable catch for each species is allocated by the Ministry of Fisheries and Agriculture each year.
- The allocation of quota shares for each vessel is based on its share in the catch of each stock in the three years leading up to the establishment of individual vessel quotas for fishing from that stock. For the major groundfish stocks, this was the period 1981-1983.
- A vessel can transfer some of its quota between fishing years but its quota is lost if it catches less than 50% of its total quota. And the net transfer of quota from any vessel must not exceed 50%.
- In order to prevent consolidation of fishing rights by a few companies, each fishing company or a group of companies is not permitted to hold more than 12% of the value of the combined quota shares of the stocks.
- A separate small boat quota system is available for boats less than 15 GT.
These five important elements of the ITQ system have insured the sustainability and efficiency of fishery. With total allowable catch for each species, fish stock can be managed and over-fishing can be prevented. With tradable quotas between vessels and between fishing years, efficiency is enhanced since quotas will be transferred to the most efficient vessels in the most affluent fishing year. With concentration control of the quotas, the rights of small fishermen are protected from big companies. Small individual fishermen are still encouraged to innovate in fishing method and technology, which diversify the fishery industry.
Enforcement mechanism
The Directorate of Fisheries is a government organization that is responsible to the issues of fishing permits, the allocation of catch quotas and the collection of all kinds of data on fishing. All the catch landed in Iceland must be weighed and reported in Iceland. If any excess catches is found, the vessel will be in risk of a revocation of fishing licenses and fines. Besides, buyers of the catch have to report value and amounts bought and the disposition of the catch, providing a double check of the catches. In spite of all the records, a team of inspectors would board fishing vessels to monitor catch composition and fishing equipment.[8] To conclude, there is a strong enforcement mechanism to support the implementation of ITQ.
Conclusion
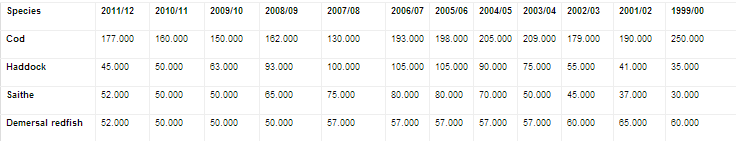
As is mentioned before, the ITQ system has been proved to be the most efficient system in Iceland. Since there is a strict enforcement in support of its implementation, the discarding of fish is minimized. From the following table,[9] which shows the total allowance catch of some major commercial species in the past 10 years, we can tell that the fish stock is well managed and protected. Some stocks even increased in the past 10 years.
Hopefully, with reference to the experience of Iceland, BC can develop a better and more comprehensive fish policy in the near future.
References
Information centre of the Icelandic Ministry of Fisheries and Agriculture
[1] http://www.fisheries.is/ecosystem/
[2] http://www.fisheries.is/main-species/cod/catch-and-fishing-methods/
[3] http://www.fisheries.is/fisheries/total-catch/
[4] http://www.fisheries.is/economy/fisheries-impacts/
[5] http://www.fisheries.is/management/fisheries-management/system-developement/
[6] http://www.fisheries.is/management/total-allowable-catch/
[7] http://www.fisheries.is/management/fisheries-management/individual-transferable-quotas/
[8] http://www.fisheries.is/management/fisheries-management/enforcement/
[9] http://www.fisheries.is/management/total-allowable-catch/