We are speculators, and speculators live on information and news.
Since there isn’t many news about the market this week, it seems we should take a week off and enjoy our mountains of assignments and midterms! And the coming Thanksgiving! 😀
Or, we could act like a cool forecaster, using technical tools to analyse the charts.
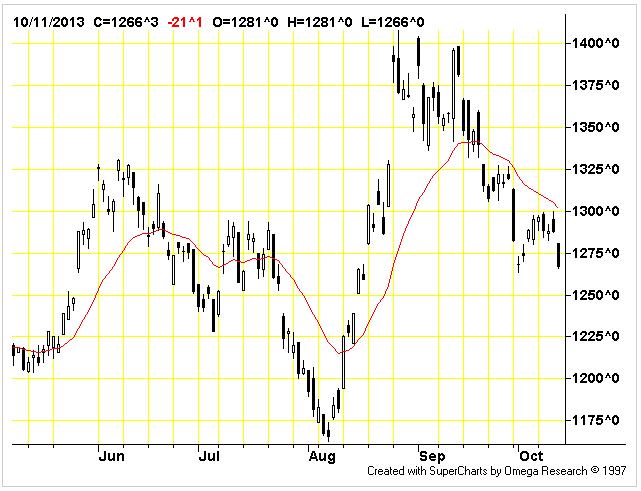
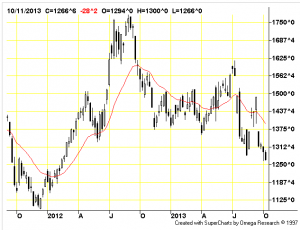
These two charts respectively show the prices of soybean in one year and two years. They remind me of the trend forecasting models in 585. In spite of some fluctuation over months, the diagrams both show a downward trend of price. Although the price is unpredictable in short term, but I am pretty sure that the price will continue to go down in the rest of the year. And the price is quite volatile recently, there is still a chance to make a last bucket of money in the following two weeks.
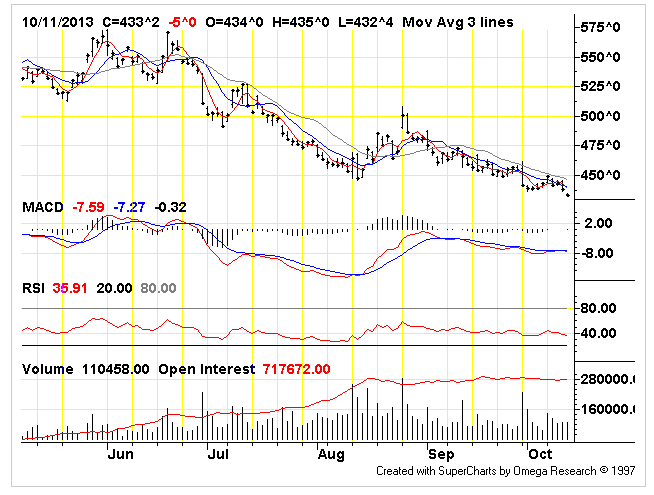
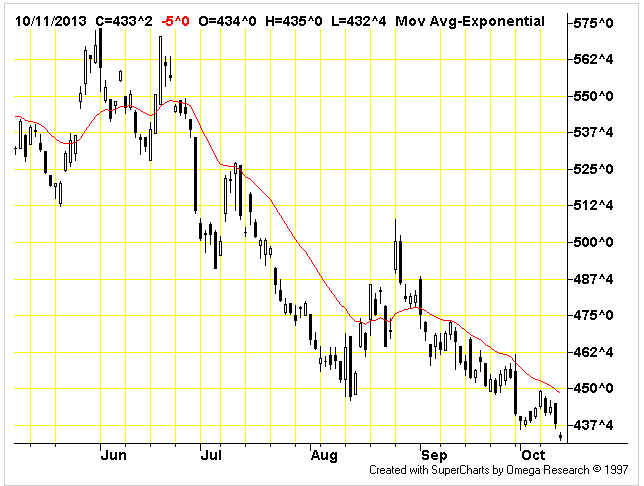
The graphs of corn is more straightforward. There were some summits Jun, early Jul and late Aug. But after that, the price just keeps falling, like a snowball rolling down the mountain. And recently the price becomes flatter than before. Maybe it has come to the prairie and want to calm down a bit. Unlike Soybean, it is difficult to make lot of money in corn market in short period.
Anyway,my strategy is short for soybean and stay away from the corn. Back to my portfolio, I was stuck in a negative situation for four days. Fortunately, Friday brings me some luck so that I could happily enjoy the long weekend lol!
![]()
Have fun guys!