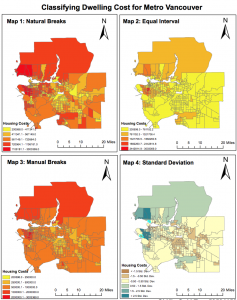
If I am a journalist, I would choose the method of standard deviation classification for my audience. It is because the standard deviation classification provides a more accurate average deviation of each class from the mean housing cost. In other words, this classification can provide audience a clearer details of housing cost distribution in different price level. Also, it is a good way to explore and show my audience the disparity between the high and low dwelling cost. The standard deviation classification highlighted the housing issues in Metro Vancouver and raised the awareness of my audience to urge government deal with the housing problem in Metro Vancouver.
However, if I am a real estate agent, I would choose the equal interval classification because in fact the housing cost near UBC area is relatively high due to the location close to UBC campus. It is better to use equal interval that viewing the price range evenly in the Metro Vancouver that this classification provides a more general detail of housing cost of the Metro Vancouver. As a result, the dwelling cost in UBC would not have a big difference and less deviance compared to other areas in Vancouver. Thus, using equal interval for presenting the housing cost near UBC is more attractive and easier to make the deal with the prospective home buyers.
There are ethical implications for y choice of classification method due to the data is from 2011 but now is 2017. Indeed, I should not use this data for presentation. It is because the data is not updated. There can be big changes in housing cost due to rapidly changing market needs for the housing, fluctuation economy, unstable exchange rate and else. The increasing populations of immigration have also greatly busted the housing markets in Metro Vancouver that more and more incomers would like to purchase the house for investment. These have greatly raised the housing prices in Vancouver which make the locals more difficult to afford the expensive housing costs. Thus, the 2011 data are not suitable for examining the housing costs in 2017.