Proposed SkyTrain Extension Routes to UBC Under Four Scenarios
Emily Leung (# 46389152)
Kaz Shigeta (#12142155)
Suki Tam (#53591153)
Fiona Tse (#47086153)
University of British Columbia
GEOB 270
Sally Hermansen
Abstract
The existing transit network in the Metro Vancouver area is reaching its capacity to operate on current road infrastructure networks. With the Broadway corridor leading East towards the UBC Vancouver campus becoming increasingly congested, a new rail system is in need of development. This project aims to identify the feasibility to extend an express railway system to the UBC Vancouver campus. The report considers four scenarios to determine the potential route of the railway system across the Metro Vancouver area. The potential routing is based on the proximity to four separate factors or infrastructure types: schools (Grades 8-12), libraries and community centres, commercial districts, and population density.
The report considers 4 separate factors to determine the potential lines running across the Metro Vancouver area.
Description of Project, Study Area, and Data
The population of Metro Vancouver is steadily rising and the transportation infrastructures cannot meet the current and the future transit demands. Adding more buses routes or bus trips is not feasible and sustainable because this would increase the burden on vehicle traffic. In order to mitigate the traffic congestion and provide a more convenient transit system for public use, we are going to propose an express rail line connecting the city of Vancouver to the University of British Columbia.
We are focusing on the Metro Vancouver due to the densely populated with a rapid urban development that the transit system is exceeding the capacity. In our project analysis, we considered four different scenarios and proposed a feasible rail route for each scenario. The four scenarios are the community centres and libraries, population density, commercial land use, and the schools areas. We choose the community centres and the libraries because these two are the main facilities that the citizens will usually go to and we find that there are not adequate transits to access these facilities. Besides, we evaluate the population density in Vancouver in order to propose a route along the least population areas in Vancouver which can alleviate the influences on the society and provide them an accessible transportation option. Also, the commercial land use is chosen due to the considerations of employments and working places in Vancouver. And we also consider the schools areas aims at assessing the rail route that are more convenient for the Grade 8-12 students to go to school. We think that the SkyTrains should close by different facilities that all the travellers can easy to access the facilities and infrastructures in Vancouver. After comparing each scenario with a proposed route, we will predict the most feasible and convenient rail route along Vancouver to the University of British Columbia.
Data is retrieved from the University of Toronto CHASS, City of Vancouver Open Data Catalogue, Data BC, and UBC abacus website.
Methodology of Analysis
To begin with our project, we collected shapefile data from the City of Vancouver Open Data Catalogue, UBC abacus website, and Data BC. Census tabular data were gathered from the University of Toronto CHASS site. We organized all the data into the same projection format, which is NAD 1983 UTM Zone 10, to ensure scale accuracy. Different datasets were clipped to the Vancouvermask layer to narrow down the total study area. The factors we used for the multi-criteria analysis to determine site suitability for SkyTrain extension were population density, commercial land use, schools, community centers and libraries. The starting points for our proposed route were existing SkyTrain stations while the end point was the new UBC bus loop. To gain a better understanding of the existing SkyTrain stations availability, we merged the clipped SkyTrain and Canada Line stations layers. The merged layer was used in all four scenarios to evaluate the need for SkyTrain services in different locations.
Schools Scenario
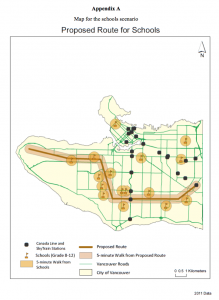
We first selected by attribute schools of grade 8-12 from the Vancouver school layer. The rationale behind this selection was that we believed students in these grade levels are more likely to plan for university and visit UBC. A new layer was created from the selection. We aimed to propose a SkyTrain route that was within a 5-minute walking distance from the selected schools. Since the average walking speed is 5.0 kilometres per hour, we buffered all the selected schools with a radius of 400m. Then we devised a proposed route that could connect most schools in our study area by editing a new line feature. A 400m buffer was created around the proposed route to indicate areas within a 5 minute walking distance from any future stations located along the route. Overlapping of the buffers means that students can walk from SkyTrain to their schools in 10 minutes and vice versa.
Community centers and libraries Scenario
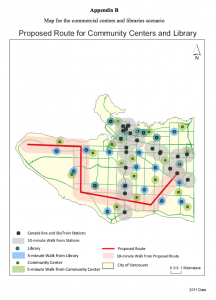
Similar procedures were applied in the Community centers and libraries scenario. We first buffered each facility with a 400m radius and we discovered that these facilities scattered throughout Vancouver. Therefore, instead of having a 5-minute walk radius, we created an 800m (10 minutes walk) buffer around each SkyTrain Station and along the proposed route in order to cover more facilities.
Commercial Land Use Scenario
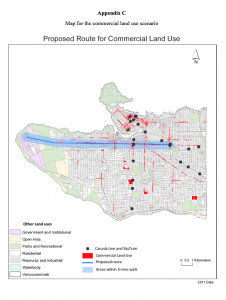
After clipping the land use date to extract the land use for Vancouver, we changed the Symbology of the Vancouver land use layer to assign a color to each ‘Category’ value (i.e. land use) to better understand the landscape. Since commercial land use is the focus in this scenario, we selected by attribute all the commercial land and created a new commercial land use layer from the selection. This layer was given a bright red color, while the general Vancouver land use layer was made 50% transparent in order to make the former stood out. As shown in the map, West to East Broadway was the most commercialized region where SkyTrain service was lacking. Hence, we created a new line feature that ran along Broadway, from Commercial-Broadway Station to the new UBC bus loop. A 5-minute walk (400m) buffer was created around the route to estimate the areas that are made more convenient due to the extension of SkyTrain.
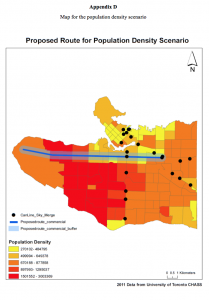
Population Density Scenario
The tabular census date we downloaded contains information on the total population in private household by Canadian citizens and non-citizens of both sexes.
The Vancouver census tract (CT) layer was extracted from the CT boundaries for Census Metropolitan areas in Canada data file through selecting the attribute “CMANAME” = “Vancouver”. A new layer was created from this selection. After that, we clipped this layer to the Vancouvermask layer to get data solely for the City of Vancouver. Next, we joined the tabular census information data to the Vancouver CT spatial layers to visualise the population density of Vancouver. COL0 in the excel table are the unique identifier for the CTs that match to the CTUID in the map files. Hence, we joined the two files using CTUID as the primary key. Then we performed quantitative data classification using natural breaks. Suppressed values (population=0) are excluded as they represent no data. The population density layer represented in a graduated color scale.
Similarly, a new line feature, the proposed route, was drawn and a 5-minute walk (400m) buffer was created around the route.
Discussion and Results
Schools Scenario
We agreed upon this scenario as we thought that students from Grades 8 to 12 would have a large interest in checking out UBC for their post secondary studies. In the City of Vancouver, there are a total of 16 high schools. For both the high schools and the SkyTrain route layers, we applied a 5 minute walking distance buffer which is 400m. The rationale behind this decision is that the average walking distance is 5.0km per hour. So where the edges of the proposed SkyTrain route buffer and the high school buffers meet indicates a 10 minute walk to the SkyTrain and vice versa. Once the buffers were applied to both the high schools and the proposed SkyTrain route, we found that 12 out of the 16 high schools were within the 10 minute walking distance to the SkyTrain while the remaining 4 were not, but 1 out of the remaining 4 is within the 5 minute walking distance from a SkyTrain station (that is not part of our proposed route).
The proposed route we put forward aims at servicing as many high schools with a direct access route to UBC as possible. We suggest that the route begin at Joyce-Collingwood station as most of the high schools in Vancouver were to the West and North West of it which is 12 out of the 16.
Community centers and libraries Scenario
We combined community centers and libraries in one scenario as we thought that many of them are close to each other. Also, we believed people who go to one of these facilities may be interested in going to the other. Therefore, it would be beneficial to take into account both facilities in this scenario to cater to most people’s needs. In the City of Vancouver, there is a total of 24 community centers and 22 libraries. 10-walk buffers and 5-minutes buffer were applied to the SkyTrain Station layer, and the community centers and libraries layer respectively. Where the two buffers touch means it is within 15-minute walking distance. We selected by location to find out the facilities that intersect with the existing SkyTrain stations buffer layer. The result shows that 13 community centers are 9 libraries are already within the 15-minute walking distance from existing SkyTrain stations.
The proposed route we put forward aims at including as many less accessible facilities as possible. We suggested the route to start from 29 Avenue Stations since the facilities southwest to it were not in close proximity to any SkyTrain stations (i.e. farther than 1200m away from stations). Another area where transportation services may be lacking is West Vancouver. A route we drew passed through these two areas. It was then buffered with 800m distance. By performing the select by locations command again, we found that 7 libraries as well as 7 community centers will be made more accessible to SkyTrain.
Population Density Scenario
We agreed upon this scenario within the city of Vancouver as we assumed that the areas with high population density already have a convenient transit system and infrastructures around those areas. However, the areas with lower population density may have less access to the transit system and might have to transfer. Thus, we aimed to propose a route that can balance the transit demands between the densely populated areas and less populated areas.
According to the population density map, the south and west side of the City of Vancouver has the highest population density while the map is clearly showing that there is a SkyTrain transit system along from Waterfront SkyTrain Station to the Marine Drive Station within the City of Vancouver. In other words, the south west areas have an accessible transit system than the north side of the City of Vancouver where the areas are shown yellow in color on the map. 5-minutes walk buffer were applied to the SkyTrain Station layer. As the UBC campus is our rail route destination, we suggest the rail route will start straightly from the Commercial Broadway SkyTrain Station through Broadway City Hall SkyTrain Station to the UBC campus. In addition, few SkyTrain stations can be added along this route in order to provide a more convenient and accessible transit system for the people who live in Kitsilano areas and the northwest side of the City of Vancouver.
This can encourage the citizens make good use of the public transportation to alleviate the traffic problem in City of Vancouver and mitigate the overcapacity problem for the route 99-Commercial. Although more assessments and consultations are needed to evaluate the social, economic and environmental impacts on the community. If the route is building on less population density areas, the consequences of the new SkyTrain route is the least.
Commercial Land Use Scenario
With an abundance in commercial land use areas throughout the Metro Vancouver region, we decided to propose a dedicated train route that is optimized for access to these areas. There are three prominent corridors of commercial areas which lack access to a SkyTrain station – Kingsway, Main Street, and Broadway. With the UBC campus being the established destination for the proposed route, we decided to route the railway system along the Broadway corridor. By routing the train along the Broadway corridor, large number of commercial zones including Commercial, Main, and Granville can be reached within 10 minutes on foot.
The proposed route will start at the Commercial-Broadway SkyTrain station, connecting to the Expo and Millennium Lines, then continue on to Cambie, where it will connect with the Canada Line, leading to increased mobility through the Metro Vancouver area. The route also aims to alleviate the high levels of congestion the Broadway corridor faces, due to the abundance of commercial buildings. By taking the riders underground along Broadway, less busses will be needed on the narrow surface road, making way for private vehicles. This process of traffic de-congestion will drastically improve commute times on the surface.
Error and Uncertainty
While conducting our research and analysis for the different scenarios of the proposed SkyTrain routes, we encountered some errors and uncertainties that somewhat hinders the effectiveness of the maps made. One of the uncertainties is that we ran into is that we were unable to download the 2016 population data from the 2016 census. This is because that particular data set is slated to be released on May, 2017. As such, we are using the population from the 2011 census which is not an accurate representation of the current population of Vancouver due to the fact that population has the potential to change drastically in the span of five years. Another uncertainty in relation with population is the fact that we do not know what the population will be like in the future. There is a chance that the population density near our proposed SkyTrain route for the low population density areas will increase dramatically and that the SkyTrain may not be able to handle the sudden influx of passengers as it was created for a low density population in mind.
Another uncertainty and error that we came across is when we were downloading the data for the proposed high school SkyTrain route. Originally we wanted to get data on the schools that had Grades 10 to 12 because we believe that these are the grades that would most likely be thinking about their post secondary education and visit UBC. This is due to the fact that for high schools in the lower mainland have two different programs: the Intermediate Program and the Graduation Program. The Intermediate Program is for Grades 8 and 9 which gets them situated in high school and prepares them for the higher grades. On the other hand the Graduation Program is for Grades 10 to 12 and gets them ready for high school graduation and for post secondary education. It is because of the Graduation Program that we believe that students in Grades 10 to 12 will be more likely to visit UBC after school to possibly “check out their future”. However the only data that we came across is was from Grades 8 to 12 and not from Grades 10 to 12. We could not find a way to separate the data that we needed so we had to use data that did not fully suit our needs. As such there may be discrepancies in the amount of students from Grades 10 to 12 that would take the proposed SkyTrain route as there will be some Grade 8s and 9s mixed in.
The final limitation that we encountered is that due to UBC changing bus loops, the final proposed terminus station location of all our SkyTrain scenarios may not be accurate as the data we downloaded for the transportation lines only included the old location for the bus loop. As such we had to manually draw in the location of the new bus loop which would also act as our terminus station for all our proposed scenarios. By manually drawing in the terminus station and the new bus loop the UBC terminus stations as seen on the maps may not be in the accurate location.
Further Research/recommendations
This project made it possible to visualize potential routing of a new railway system to UBC campus, following different infrastructures/factors. While the proposed routes identify an approximation of the train lines, there is potential for further research on this topic.
Additional to the routes, proposed stations could be added to the proposed lines. By conducting further geospatial analysis along the proposed routes, the locations of the stations can be determined based on potential ridership numbers as well as spatial feasibility on the surface. Such analysis will add more weight to the proposed lines, as it will test their realistic feasibility.
A cultural impact assessment of the tunnel boring and station construction process could be conducted. While a large portion of the proposed lines are under urban areas deemed as public space, land closer to UBC consists of First Nations Territories. By assessing the traditional uses for those lands, better potential routes can be identified to circumnavigate culturally sensitive areas.
A spatial cost analysis could be conducted to determine if portions of the rail line could be raised above the surface level as opposed to being underground. The building costs could potentially be lowered if less tunnel boring was necessary for the rail routes.
Bibliography
Canadian Census Analyser. (2017). 2011NHS Canadian Citizens. Retrieved from http://datacentre.chass.uToronto.ca/census/
City of Vancouver. (2017). Open Data Catalogue. City Streets data package. Retrieved from http://data.vancouver.ca/datacatalogue/cityStreets.htm
City of Vancouver. (2017). Vancouver Land Use. University of British Columbia, Geography. UBC G:Drive Database. Retrieved from G:\courses\data\vancouverlanduse
City of Vancouver. (2017). Schools. University of British Columbia, Geography.UBC G:Drive Database. Retrieved from G:\courses\data\school
City of Vancouver. (2017). Library. University of British Columbia, Geography. UBC G:Drive Database. Retrieved from G:\courses\data\library
City of Vancouver. (2017). Community Centres. University of British Columbia, Geography. UBC G:Drive Database. Retrieved from G:\courses\data\communitycentres
City of Vancouver. (2017). Public Transit 2010. University of British Columbia, Geography. UBC G:Drive Database. Retrieved from G:\courses\data\publictransit
Appendix
Individual submission on experience with final project
- Summarize the project: your team’s project proposal and goal?
The existing transit network in the Metro Vancouver area is reaching its capacity to operate on current road infrastructure networks. With the Broadway corridor leading East towards the UBC Vancouver campus becoming increasingly congested, a new rail system is in need of development. This project aims to identify the feasibility to extend an express railway system to the UBC Vancouver campus. The report considers four scenarios to determine the potential route of the railway system across the Metro Vancouver area. The potential routing is based on the proximity to four separate factors or infrastructure types: schools (Grades 8-12), libraries and community centres, commercial districts, and population density. The report considers 4 separate factors to determine the potential lines running across the Metro Vancouver area. After all, we found that some errors and uncertainties that somewhat inhindered our map creations. However, we made some suggestions to address those issues. Overall, we wanted to visualize the potential routing of a new railway system to UBC campus.
2. Project Management
First of all, our members are not from the same lab group, hence it is a bit difficult to hold a meeting to discuss about the project at the same time. And as we were all in the hard time of the semester, distribution of work was very important to complete the final project. At the very beginning, we brainstormed what topics we wanted to investigate and came up with five interesting topics around the Metro Vancouver. Then we voted for the topics by considering the most feasible project. And I suggested different scenarios for our project and started retrieve data from different sources. After creating all the maps, each member responsible for our own parts in written report. We created a group chat on Facebook which we can help each other to solve the problems when we were writing our written project. And I am always willing to help the members who were in a very busy time for the assignments, mid-terms as to minimize their work burdens.
3. What are some interesting things you learned as a result of the process?
The most interesting and challenging things of the project is to decide what to do and design a project without full set of instructions like the lab instructions. This course is my first time to use GIS analysis to do different geographical assessment. I think this is a very useful technique due to we need environmental assessment for every construction projects for balancing the social, economic, and environmental aspects. Teamwork is always the hardest part in doing a project because we need to collaborate and gather different opinions about the data. For example, different data files will have different visual impressions or even affect the data discussions. In acquiring the census data for the population density map, we found that we downloaded some unnecessary data which affected the outcomes. There were few failures in doing the project, but we all tackle the difficulties together.