Income
When looking at the Income map (Figure 1), Mall 3 is surrounded by higher income neighbourhoods ($109,381 – $138,459) compared to Mall 1 and Mall 2. For this reason, Mall 3 was chosen to be the ranked as 1st, Mall 1 had the second highest income in the surrounding neighbourhood ($91,990-$109,380) making it rank 2nd and Mall 2 as 3rd.
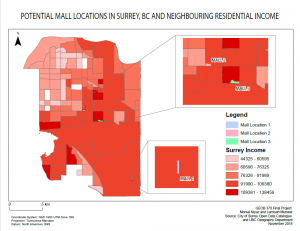
Fig.1: Income analysis map. Mall location 3 has the highest income neighbourhoods in its surrounding.
Shortest Time and Distance
Mall 2 had the shortest time and distance (10 minutes and 10,200 meters) from Surrey Central Station to the mall location allowing it to be ranked 1st as seen in Figure 2. Mall 3 had the second shortest time and distance (13 minutes and 14,600 meters) making it 2nd. Mall 1 is ranked last as it has the longest distance and time (24 minutes and 25,300 meters).
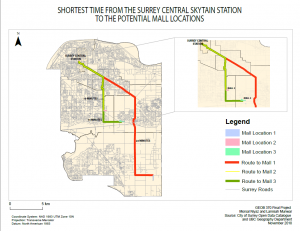
Fig.2: Network analysis with shortest route mapped. Mall 2 had the shortest route from Surrey Central station in terms of time.
Parcels Used
When looking at the Surrey Plot Divisions (Figure 3) the plot polygons represent a separate parcel that would need to be bought if the mall were to be built in that area. Mall 2 is shown as an entire parcel, whereas Mall 1 is split into two parcels and Mall 3 is split into many.
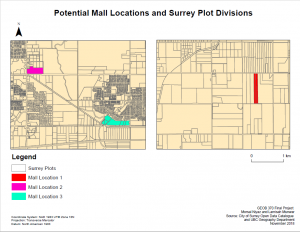
Fig.3: Surrey Plot divisions map. Mall location 2 had the least number of divided plots hence should be more convenient for developers to buy off compared to Mall location 1 and 3 which had multiple divisions.
| Highest Income | Shortest time from Surrey Central Station | Distance from Surrey Central Station | Least amount of parcels used | Best Location | |
| Mall 1 | 2 | 3 | 3 | 2 | Third Choice |
| Mall 2 | 3 | 1 | 1 | 1 | First Choice |
| Mall 3 | 1 | 2 | 2 | 3 | Second Choice |
Table 1. The ranking of each factor (1 = favourable, 3 = least favourable) for each mall location to see which one of the three would be the best choice for development.