Many people are proud to call Vancouver their home as they are close to lush, green forests as well as a sandy beach at the same time. Despite the beautiful landscape, it has been found that homes in Vancouver cost 11.8 times more than the median income (Robinson, 2017). This might cause people to relocate to cheaper cities in the future as the city’s livability decreases. In this lab, I created a map to display the difference in housing costs and affordability in Ottawa and Vancouver.
Quantitative Data Classification
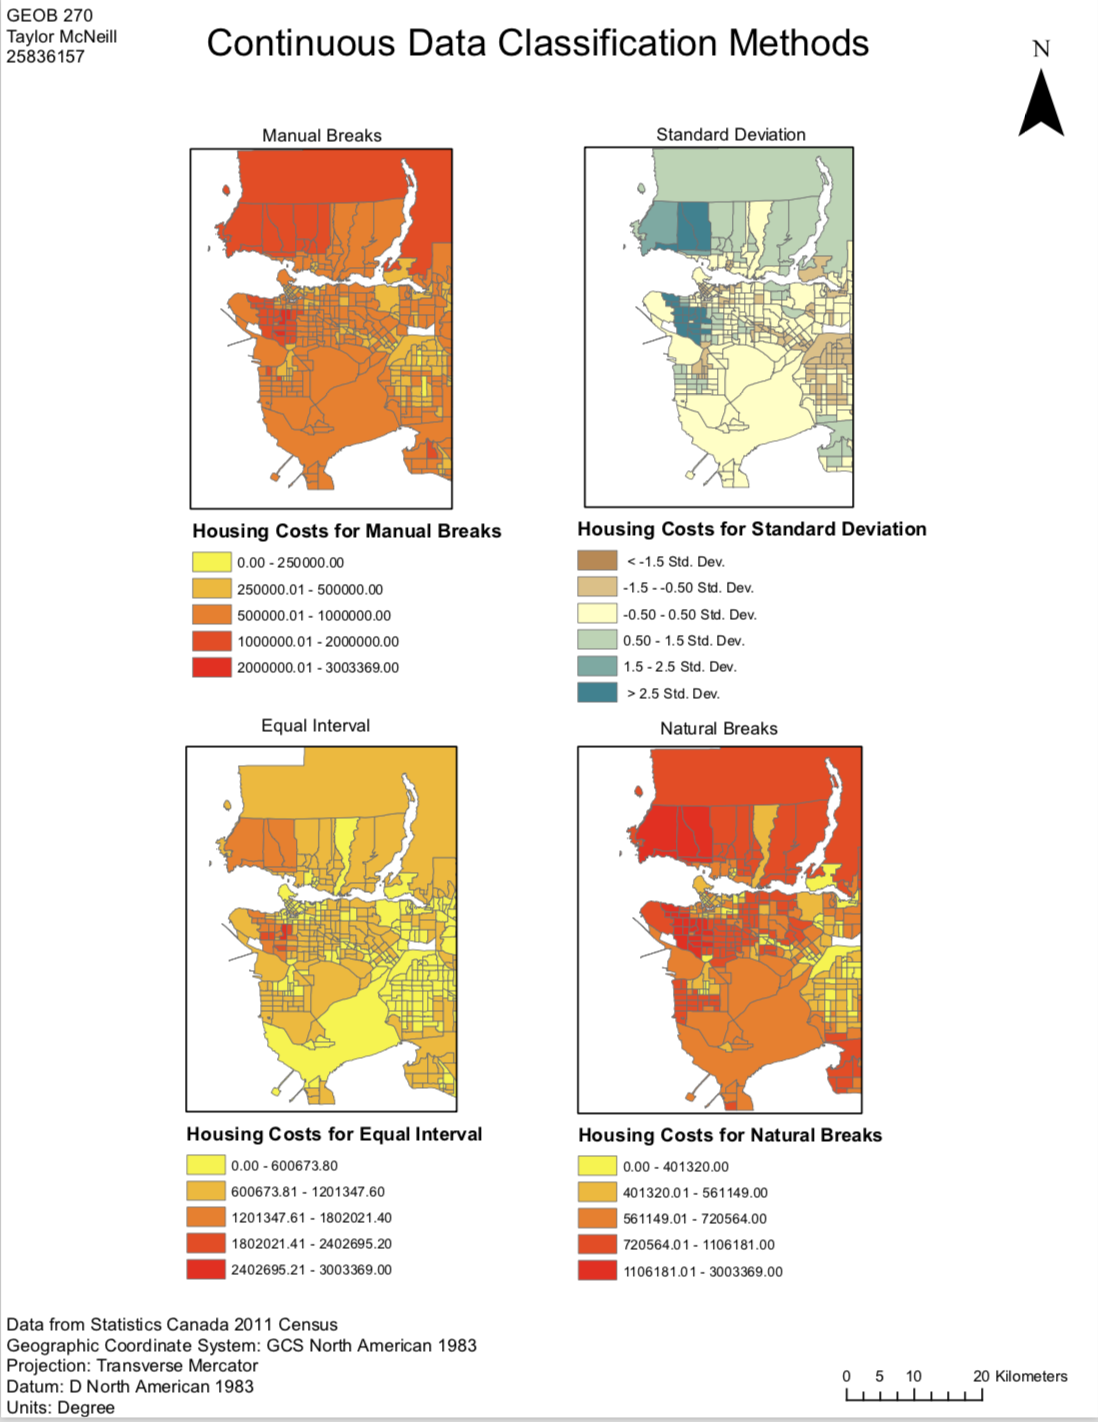
Above I have shown an affordability map of Vancouver in four different classification methods. Each map uses the same data but the affordability in each can be represented in different ways depending on how the prices of the areas are classed together and what you want to emphasize on the map.
If you were to want to display the housing costs in Vancouver, the manual break classification method allows you to define your own range and classes that would show a clear range of housing costs for the citizens of Vancouver. Rounded numbers allow people to read the numbers more clearly to find a good fit for their budget. If you were a real estate agent you might want to use this data classification method as you can manipulate the data to make your properties fall in a reasonably priced area to make your customers think they are buying a good priced home relative to the rest of the city.
If you wanted to prepare a presentation for prospective home buyers near UBC, the equal interval data classification method would allow the representation to show the relatively cheaper priced homes closer to the school. This would cater better to those who are looking for housing in this area as they would most likely be looking to live near the University of British Columbia and are on a student budget looking for reduced rent price.
Both types of data classification will work when portraying housing affordability but they both might have an ethical issue as they can both manipulate the data to look more or less affordable in one area than another.
Housing Affordability
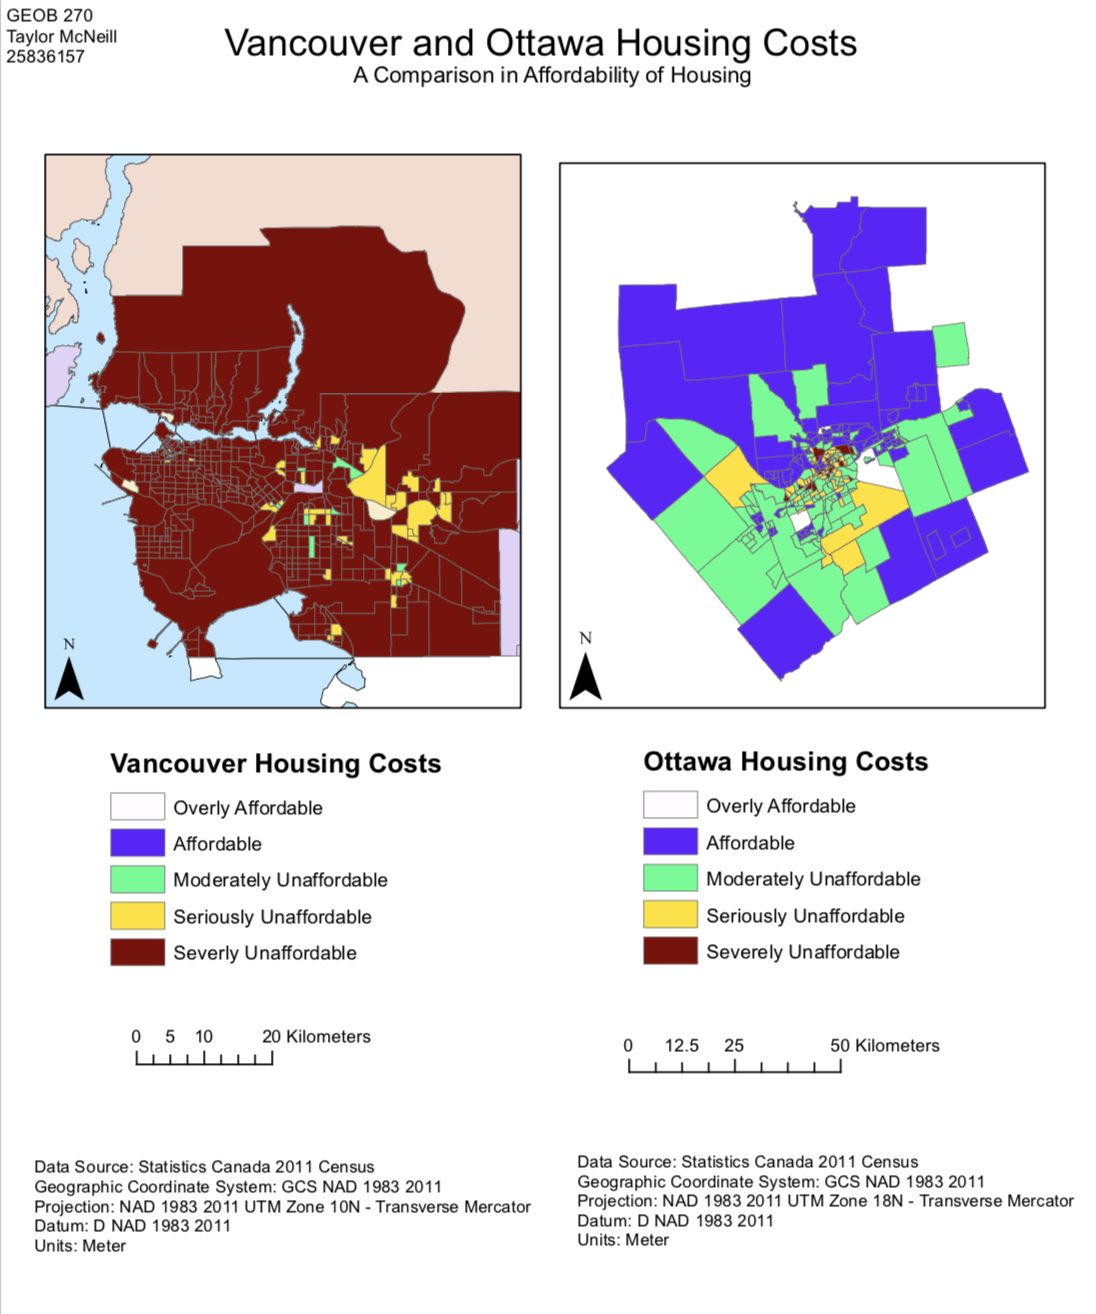
Affordability is defined as the extent to which something is affordable, as measured by its cost relative to the amount the purchaser is able to pay (Workdnik, n.d.). The affordability of something will measure people’s incomes or abilities to purchase something and whether or not a city is considered “livable”. If the housing cost in a city, for example Vancouver, is so high that people cannot truly afford it, then that city is not considered “livable”. Affordability measuring is a better index to determining housing affordability than just housing costs because a housing cost will show its true price without regard to people’s incomes.
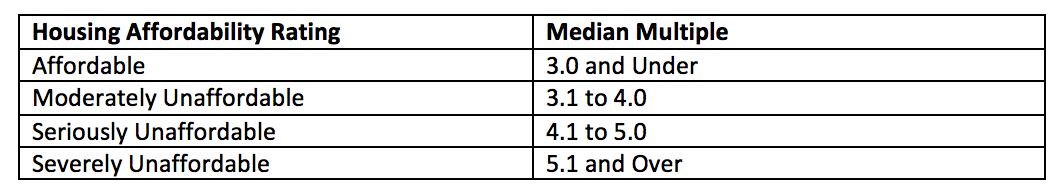
In the map I have shown above, the housing affordability data between the two cities was compared using 2017 Demographia International Housing Affordability Survey categories which was written by Wendell Cox and Hugh Pavletich. A ratio called the “Multiple Median” is used which takes the median house price and divides it by the gross annual median household income. The categories are:
Affordability in Relation to ‘Livability’
There are many different aspects to look at when considering a city’s “livability” but housing affordability is one of the more important factors to look at as it determines if people are able to remain in the city to work or start a family. As Vancouver continues to be ranked as one of the most livable cities in the world, the Demographia International Housing Affordability Survey’s classifications prove that Vancouver is actually the third most unaffordable city in the world (Cox and Pavletich, 2017). You must also look at factors beyond living conditions and look at circumstances that are harder to measure such as health, happiness, education, social and leisure, safety and the environment.
Here are a few of the main skills that I have obtained while working with ArcGIS for this lab and in this course:
- Was able to calculate the area of risk through summary and attribute tables as well as identify types of lands that would be affected by a tsunami
- Reclassified a DEM of the COTY of Vancouver to perform a buffer analysis to identify the low-elevation areas that are in risk
- Was able to learn about the different data classification methods and to know when it is best to use each type for what you are trying to display on your map
References:
Robinson, M. R. (2017, September 25). Experts take on B.C.’s housing-affordability crisis at annual UBCM. Retrieved November 24, 2017, from http://vancouversun.com/news/local-news/experts-take-on-b-c-s-housing-affordability-crisis-at-annual-ubcm
Wordnik . (n.d.). Affordability . Retrieved November 24, 2017, from https://www.wordnik.com/words/affordability
Cox, W., & Pavletich, H. (2017). 13th Annual Demographia International Housing Affordability Survey: 2017. Retrieved November 24, 2017, from http://www.demographia.com/dhi.pdf