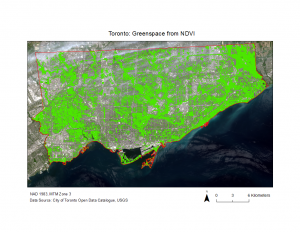
Studies have shown the presence of green space, public or private, is closely linked to the income of places that have green space in abundance or lack it altogether (Perkins, 2015; Wolch et al., 2014). Therefore, it was necessary for public and private green space to both be accounted for in our analysis if it was going to be compared with income. For the purpose of this project we refer to public and private green space together as net green space.
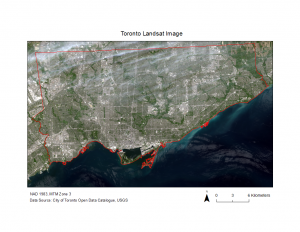
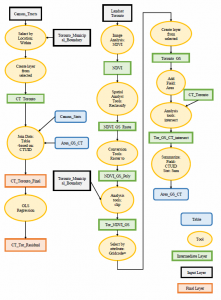
To establish a layer that reflected the net green space area of Toronto we opted to use normalized difference vegetation index (NDVI) imagery. To produce the NDVI image we used Landsat 8 imagery from Earth Explorer, a database of satellite imagery managed by the United States Geological Survey (USGS). Using the query system in Earth Explorer we selected an image of the Toronto area from May 2017 with less than 10% cloud cover. When querying the database we looked for images between the months of May to July from 2017 to reflect the full extent of vegetation at the height of the growing season.
After a suitable image was selected it was then possible to use the image analysis tool within ArcGIS 10.5 to produce an NDVI image of the Toronto municipality. NDVI images are produced by subtracting red band reflectance from near infrared reflectance (NIR). Once the difference is calculated it is normalized by the sum of red band and NIR reflectance. This produces a normalized raster field of values ranging from -1 to +1, with values closer to positive one indicating areas with vegetation present (Weier, J., Herring, D., 2000).
NDVI=NIR-Red/NIR+Red
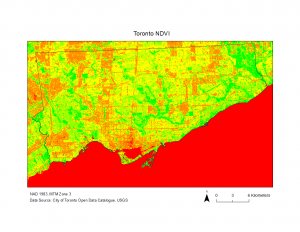
Once the NDVI field was produced it was possible to reclassify raster values in order to isolate cells indicating the presence of vegetation. For my analysis I classified all cells with values over 0.27 as being indicative of vegetation. Once the raster was reclassified a new vegetation layer indicating the net green space of Toronto was extracted.
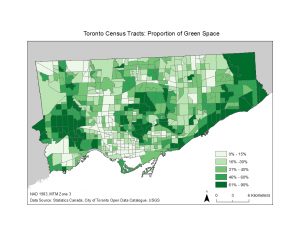
After our net green space polygon feature class was created we intersected the polygon by Toronto census tracts making it possible to calculate the sum net green space per census tract. This information could then be joined to our original census tract layer containing our relevant statistics for analysis. For our analysis we opted to do an aspatial OLS regression. By doing so we could analyze the extent to which our dependent variable of ‘proportion of green space per CT’ related to the median household income in each respective Toronto census tract.
Proportion of Green Space by Census Tract
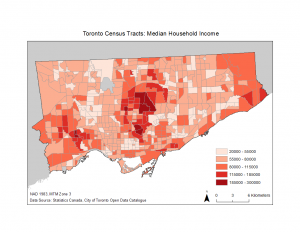
Median Household Income by Census Tract