Our OLS regression exploring the extent to which median household income explains the proportion of green space came up with an interesting result. After running the regression we can see that the proportion of green space and the median household income of census tracts are positively correlated with a coefficient of 0.000272.
Scatter proportion GS vs median household income
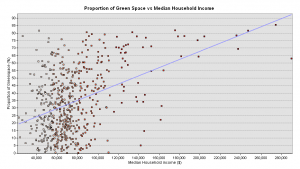
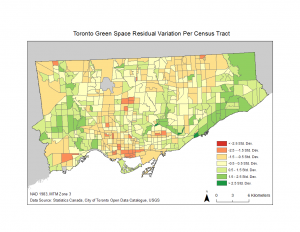
Our regression calculated an adjusted correlation coefficient (R2 ) value of 0.17, meaning that the median household income of a census tracts explains 17% of the observed pattern of the distribution of green space in Toronto CTs. The regression analysis allows us to plot residuals on a map, this highlights Toronto CTs with higher than or less than expected proportions of green space based on their median income.
Calculating residuals allowed us to validate the model by testing it for spatial autocorrelation. Using ArcGIS spatial statistics to calculate Moran’s I, we found that our residuals were clustered and had significant spatial autocorrelation (I= 0.41, z-score= 25.5). This indicates that there are other variables outside the scope of this project that can explain the proportion of green space in Toronto Census tracts. Some other explanatory variables that may explain the presence of green space could be factors such as dominant housing type in the CT, presence of streams, population density, etc.