As we stated previously, one of the objectives of this project is to “evaluate the reliability and consistency of the results, and to further assess the reasonability and practicability of the results”. Do we actually achieve this goal? To interpret that, the following content demonstrates the limitations that we encountered while conducting the research, and some insightful points that are valuable for relevant future studies.
Possible Methodological Limitations
-
Data Limitation
A lack of data will likely limit the scope of your analysis, and it can be a significant obstacle in predicting and in finding a meaningful result. Here are some specific limitations we encountered:
1.One of the biggest limitations in our study is the fact that, some of the important criteria data is either non-public or missing. In this study, land cost would be an important constraint we should be careful with. It would be unrealistic to propose a property building plan without considering building budget. We took land cost in to account as one of the main constraints in this project but we could not find any corresponding data in governmental open data websites. Therefore, the result in this project would be inevitably affected.
2.Access to convenient and “green” transportation is one of the most important factors in building new affordable housing. This consists of the access of subway, bus, bike lane etc. However, we can only find the subway data. The rest of the datasets are missing and we could not find them. This significantly limits our study.
3.We noticed that the zoning data is not comprehensive even it is downloaded from authoritative website. There are some so-called “Unassigned Area” and area with no value in zoning data which confused us and we could not identify the property of those area. To play it safe, in this case, we decide to view the undesigned area as where we should avoid building new affordable houses on.
4.Based from the results of MCE to determine building sites for affordable housing. There could be data limitation when applying the constraint of current affordable housing and determining the area required if we increased the number of affordable housing by additional 500. For this case, we have to select enough pixels to cover 500 more affordable housing, and we are using the area of an average affordable housing for our calculation. In fact we don’t have access to their physical size individually. The construction files for individual affordable housing is hard to retrieve, and some affordable housing could be larger than the an average area of an affordable housing. Let’s assume we have found the locations of affordable housing, and made sure they don’t collide with current affordable housing but that is because we have used the average area of a single affordable housing derived from the total area used to built current affordable housing. When conducting developmental plans for affordable housing is how much area is opened to construction, and the occupancy of neighbourhood building.
-
Lack of previous research studies on the topic
Citing and referencing prior research studies constitutes the basis of the literature review for research, and these prior studies provide the theoretical foundations for the research question you are investigating. However, depending on the scope of our research topic, prior research studies that are relevant to our thesis are limited. There are only one official Toronto affordable house building guideline available (Housing Opportunities Toronto (HOT) Action Plan 2010-2020), and the building criteria are not explicitly defined. To conduct the research, we read and summarised the corresponding regulations carefully and listed the criteria based on our own understanding. It is possible that the criteria are subjective or even biased.
-
Objectivity, feasibility and more
Another limitation of our project is that our results are based on our biased goal of “finding area the for building 500 additional affordable housing” before adding constraints. The number of 500 is arbitary, we want to make sure that adding constraints would not exclude too much of the optimal area. We do not know if the area in our final results is large enough to address the needs for affordable housing. Also, we did not consider units of housing, height limit assigned by zoning by-law. Therefore, we are uncertain about the number of housing units can be provided by the area in our final results.
Uncertainty also exist in our calculation on the area needed for building 500 additinal housing. To figure out how much land we need to build 500 affordable housing, we need to know the average land area of current affordable housing. To do so, we conducted a spatial join with current affordable housing point with the zoning polygon. Then we used the total area of these polygons and the number of affordable housing to calculate the average land area for one affordable housing. However, this may not be a precise reflection of the actual land area of one single affordable housing. Because we do not know if there is other land use in one zoning polygon. Total area of the zoning polygons that contain existing affordable housing does not necessarily reflect the actual floor area of all affordable housings.
Insightful points
-
Difference between MCE results and MaxEnt results
As shown in the map below, MCE and MaxEnt produced results with consistent patterns in general. The MaxEnt data is more precise as compared to MCE. One of the reasons for the difference in precision is that we did not include all factors that effect the decision-making on affordable housing location. Important data is missing as discussed before. Constraints were not yet added to MCE results below, while MaxEnt already have the existing affordable housing location as input data. We also noticed that the grading scheme for MCE and MaxEnt is not the same. As shown below, the distribution of data value in the two models are significantly different, with MCE have most cluster on the higher end, MaxEnt have limited points with high value. In other words MaxEnt is more strict in evaluating a location’s suitability for affordable housing.
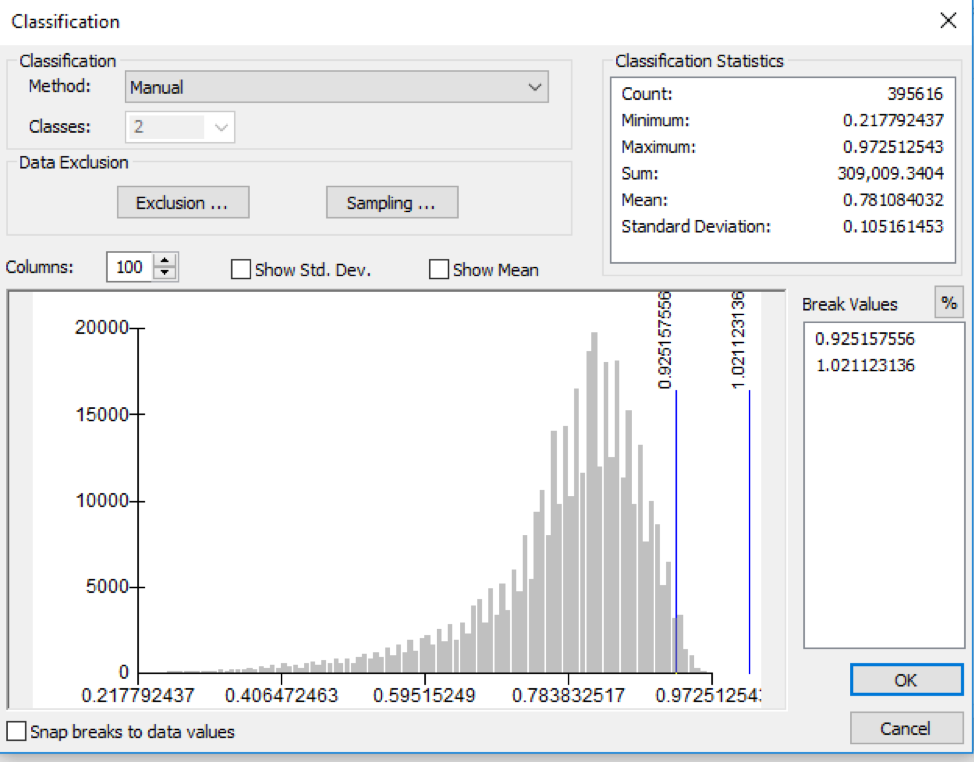
Distribution of Point Value in MCE
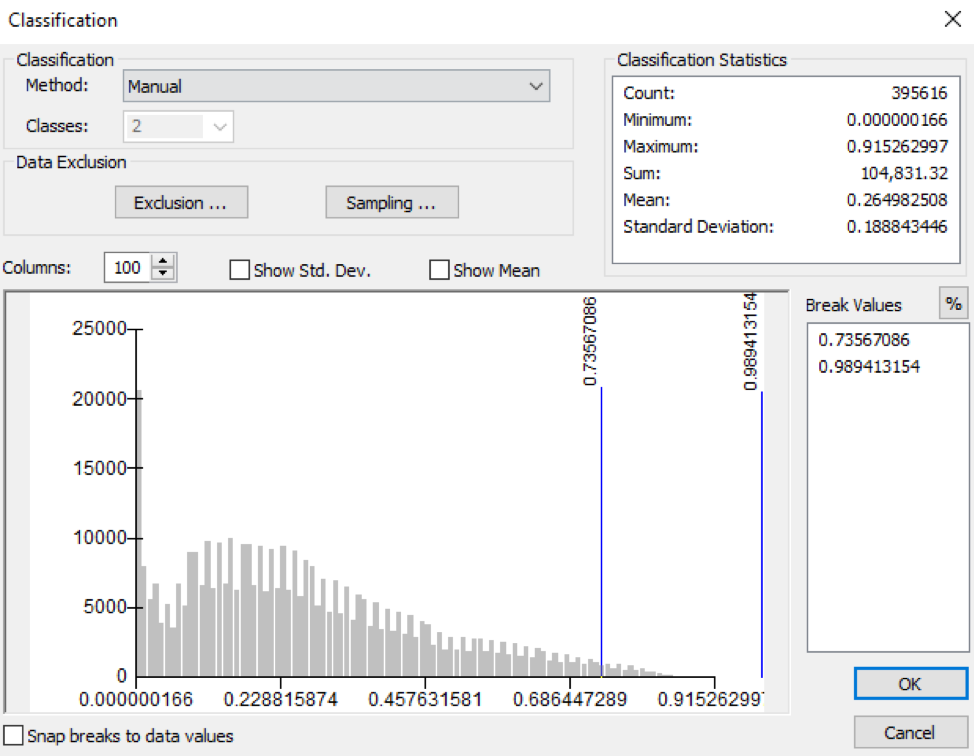
Distribution of Point Value in MaxEnt
We also noticed some areas of significant inconsistence. For example, the area indicated in black box is suitable for affordable housing in MCE model and very unsuitable in MaxEnt prediction. Thus, we took a look at the Google Earth to see the actual usage of the area. It turned out that this is the site of Downsview Airport. Before this airport was sold, it was once an air force base. The future for this airport is uncertain as for now. In our zoning data, zoning for the Downsview Airport area is “unassigned”.
This reminds us the fact that MCE is evaluating based on the current Zoning By-law 569-2013, and MaxEnt prediction is based on the location of current affordable housing, which reflects the previous zoning policies.
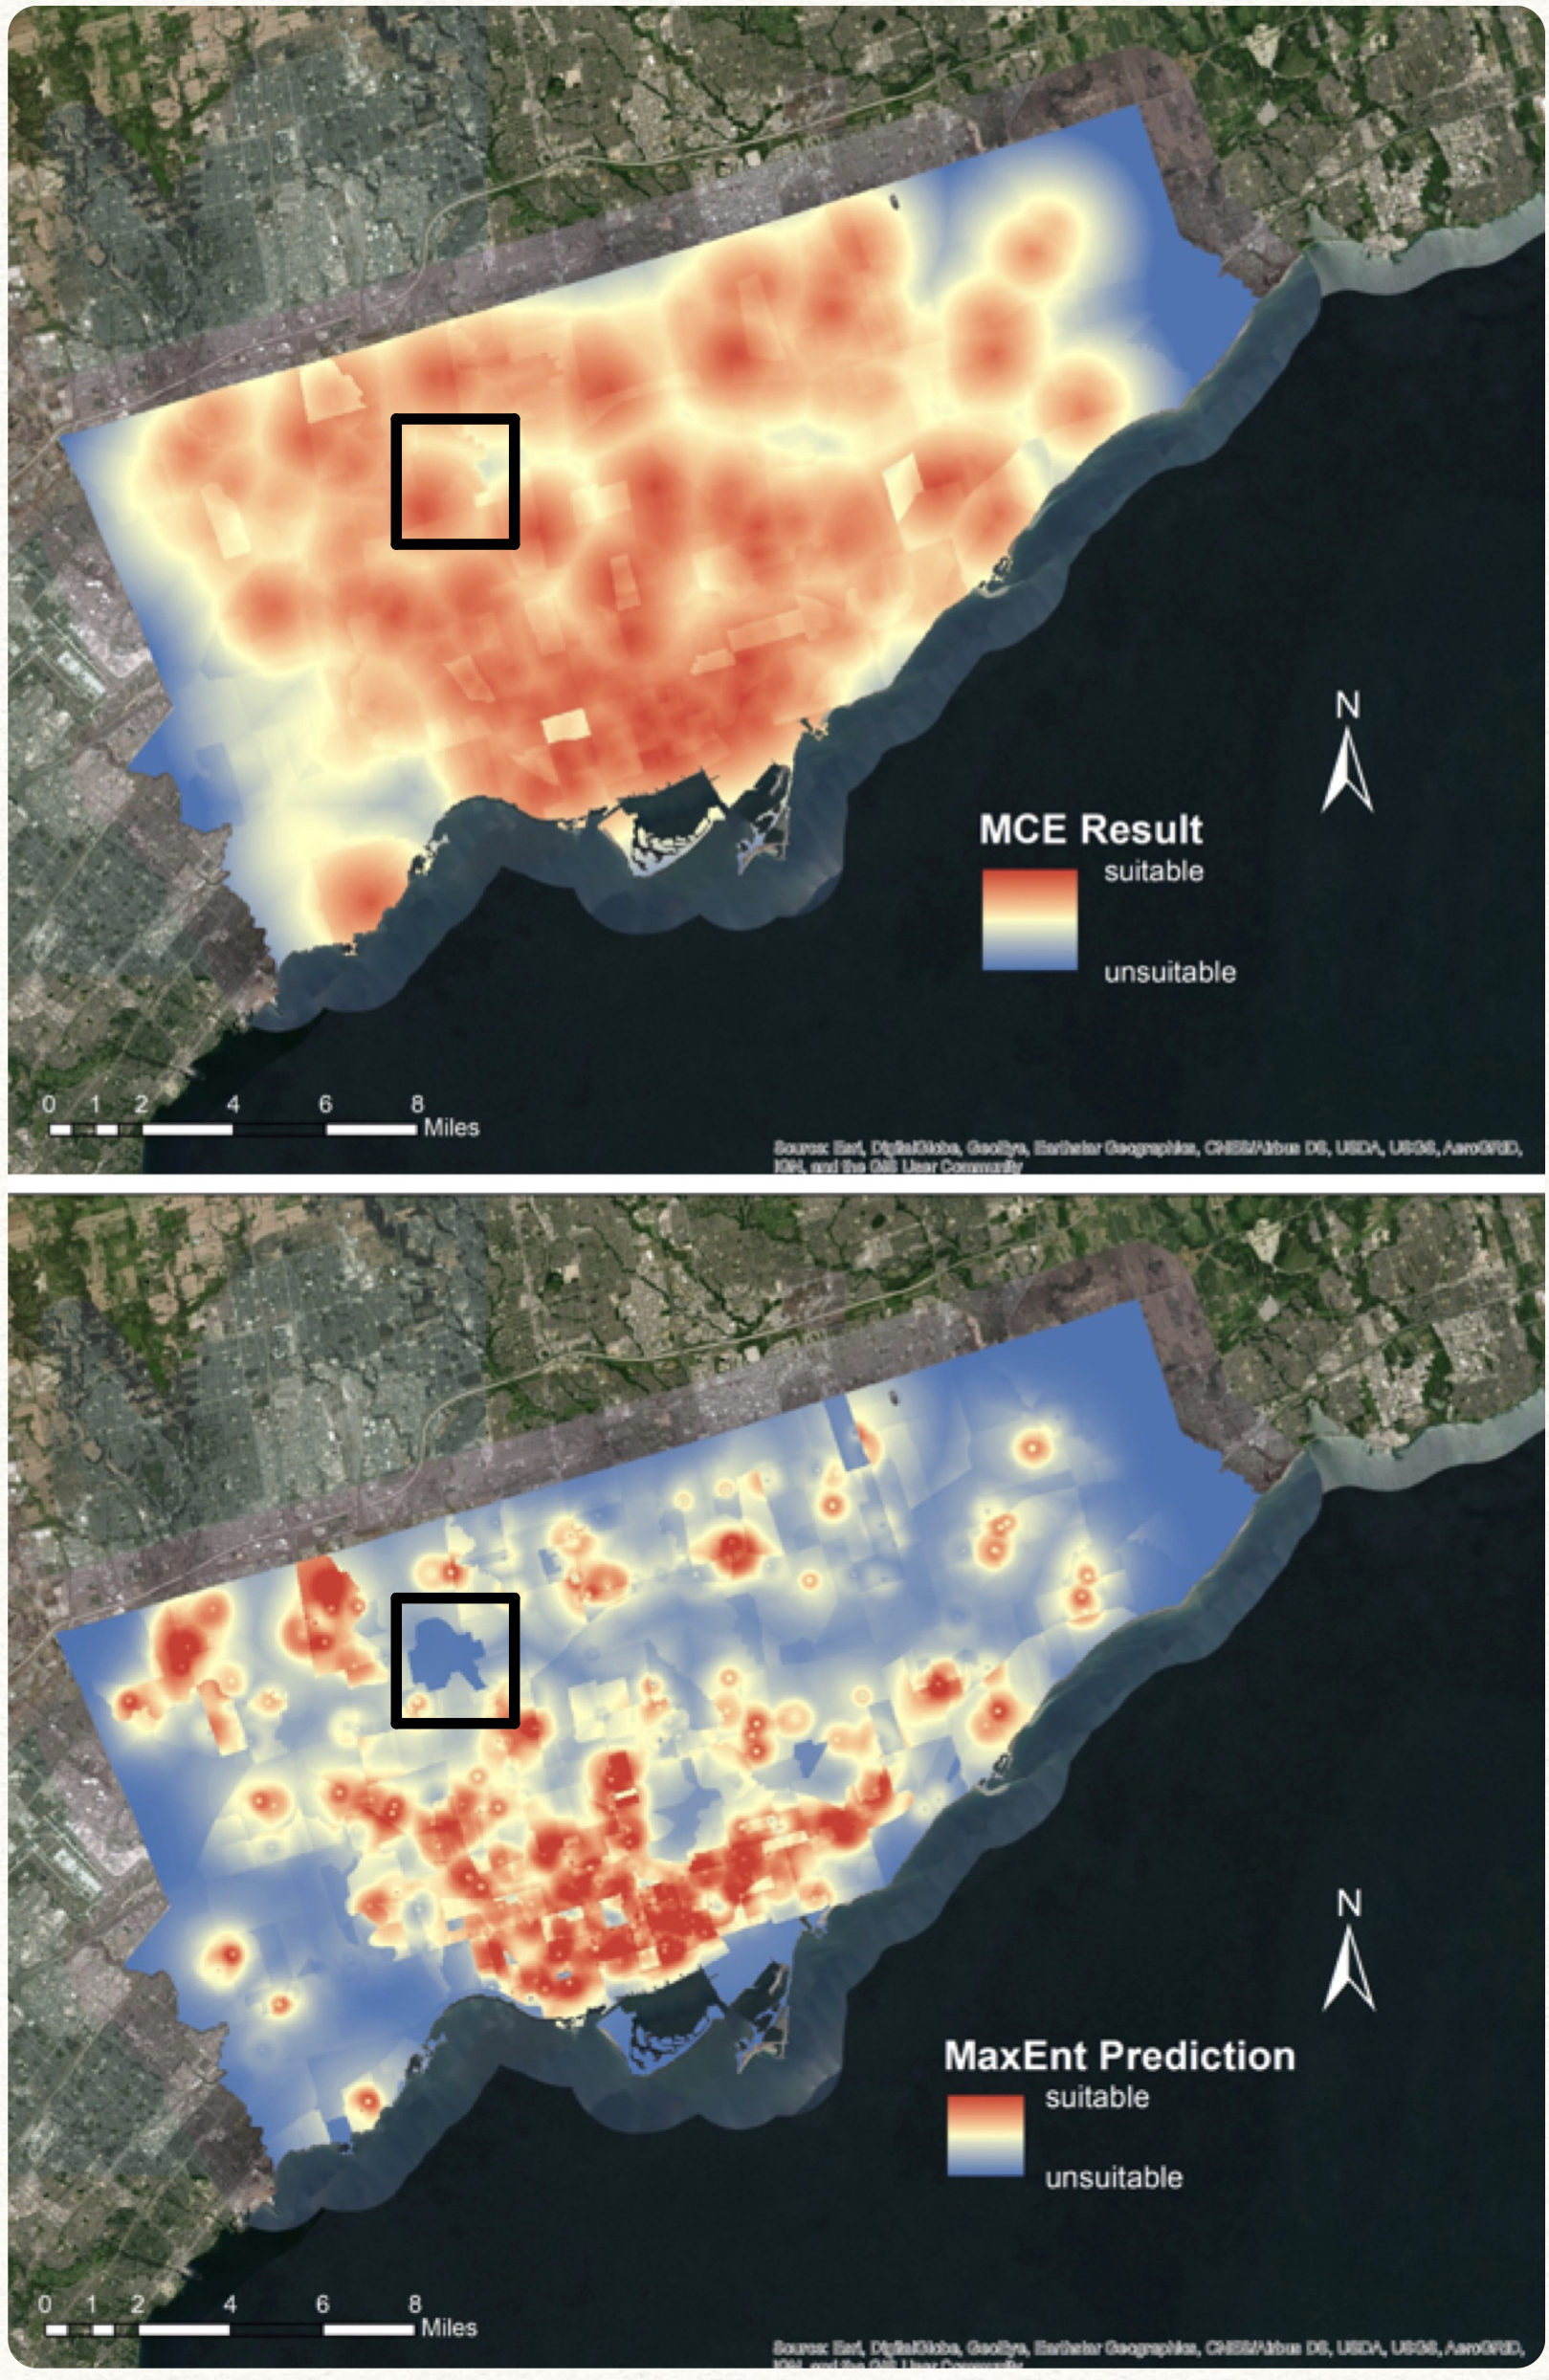
Comparison between MCE and MaxEnt results (constraints not included)
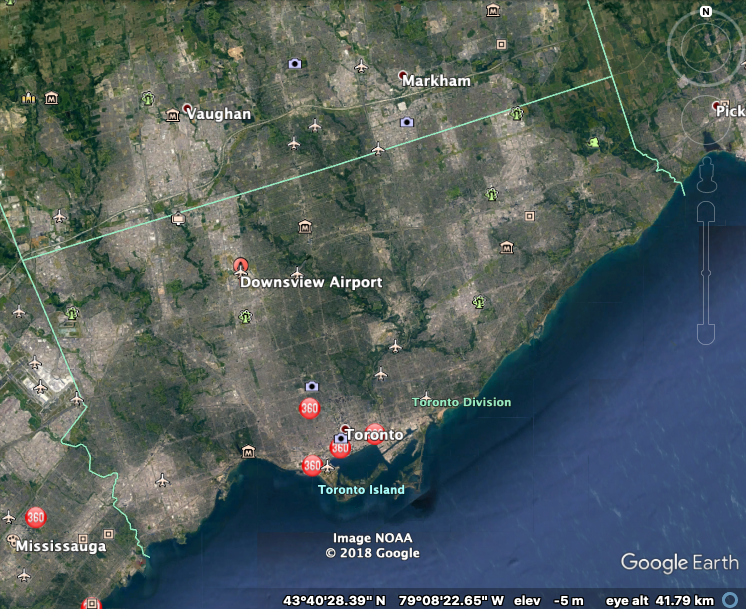
Downsview Airport (Source: Google Earth)