The following content demonstrates the full Maxent prediction report, weights determined by Maxent, visual presentations of prediction result done by using MCE and Maxent respectively, and a MCE-Maxent overlay result.
The full Maxent report is attached below and we were able to discover significant results of each variable’s weighted distribution for our MCE (Multi-criteria evaluation). The output of the maxent model would calculate potential locations of affordable housing based on our criteria and measure the importance of each individual variable.
Source file: Maxent-model-for-Affordable-Housing
| Variable | Percent contribution | Permutation importance |
| Skill training center | 38.2 | 21.7 |
| Adult education | 22 | 22.1 |
| Crime rate | 14.9 | 7.6 |
| Hospital | 9.8 | 11.7 |
| Subway Station | 6.3 | 17.1 |
| Low income population | 5 | 5.6 |
| Mental health Centre | 3.8 | 14.2 |
From the variable contribution table of the Maxent model attached above, it displays skill centers that are the most important factor with a 38.2% contribution to our existing sample. It would be considered the most in the development of constructing potential affordable housing considering their locations, and mental service centers contributed less at 3.8%. The permutation importance measures how much geography mattered for those variables, and in case they had been located somewhere else in our training site. The percent contribution outlines the weighted percentage of each variable that is applied to the result 1. skill training center 2. Adult education 3. Crime rate 4.Hospital 5.Subway Station 6. Mental health Centre. The results of the Maxent model would be influenced the most due to adult education and highlighted by permutation importance.
The following maps demonstrate our results by applying MCE and Maxent:
Please note that unless stated otherwise, projection for all maps is UTM NAD 1983 Zone 17 in this page
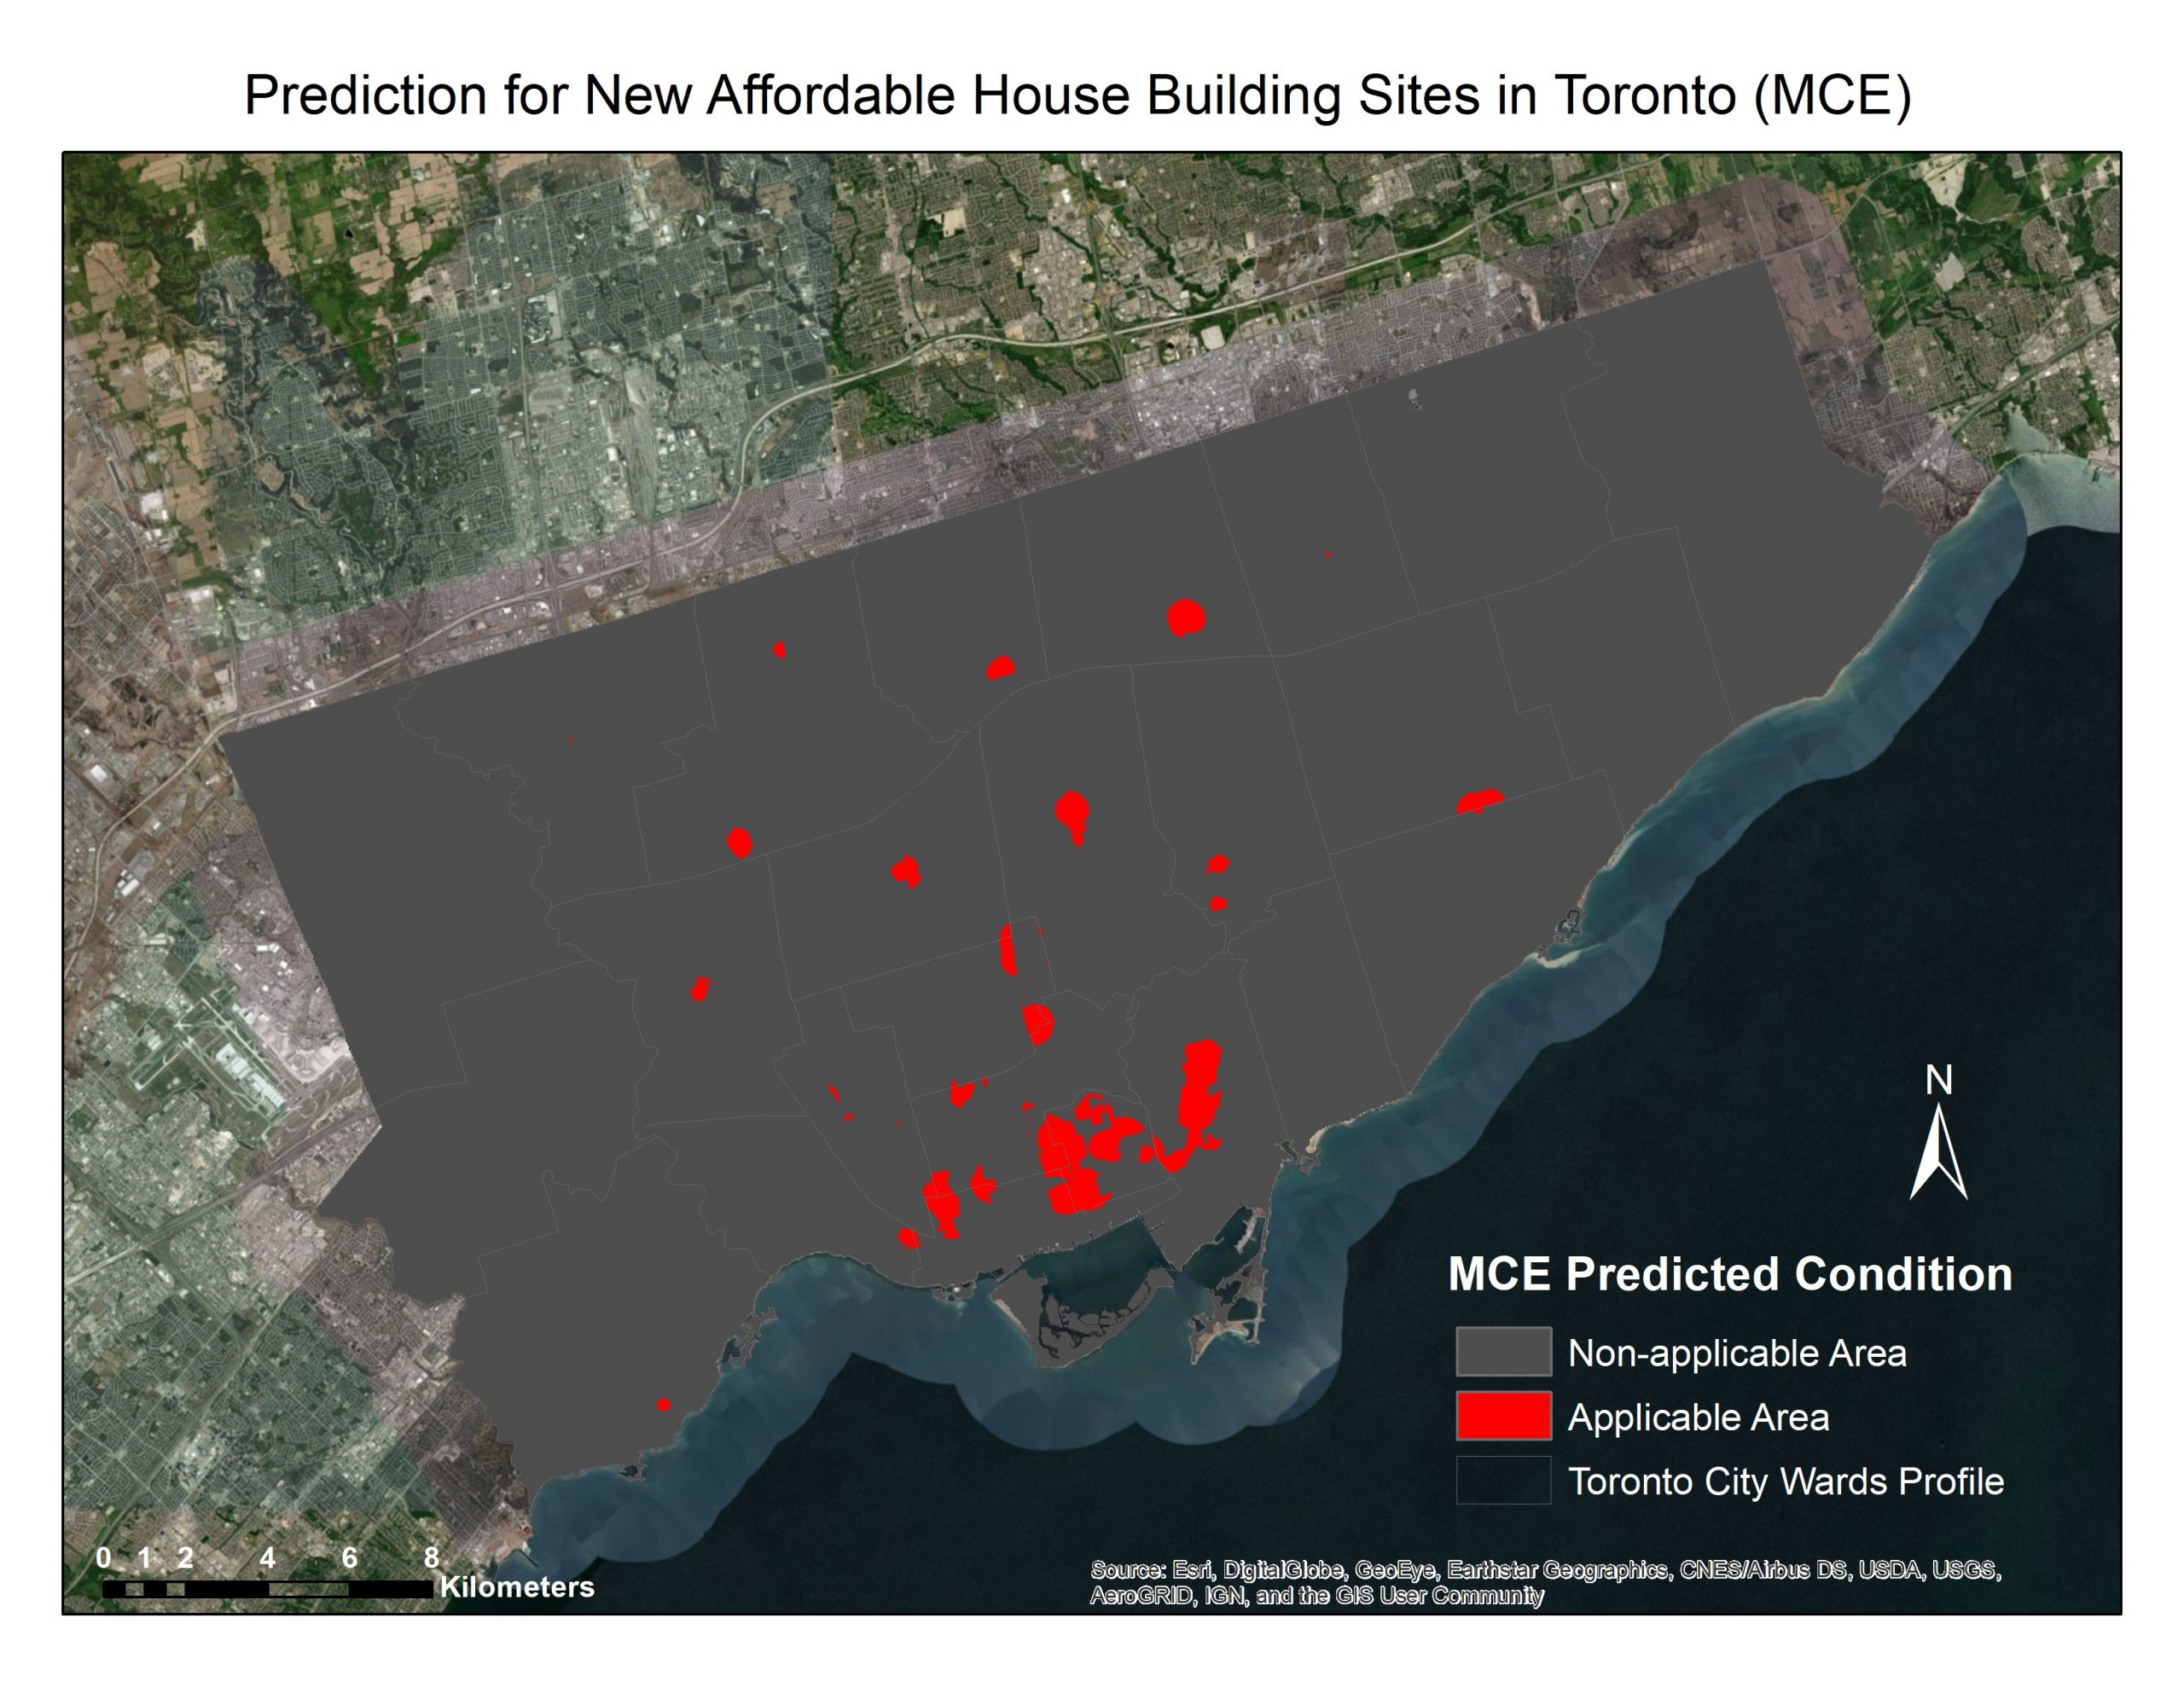
Figure 1: The prediction for potential affordable housing locations based on increasing the number of affordable housing by 500 using MCE and before adding constraints.
Figure 1 is an output of MCE that provide information on the applicable area of affording housing versus non-applicable area before applying constraints. Assuming that we want to add the number of affordable housing by 500 sites, and we can better understand the most suitable location for building new affordable housing. We want to make sure there is still enough affordable housing shown on the map after adding constraint. The grey areas are parts that are not applicable because the locations selected are based on those that best fit the criteria for affordable housing and produced by MCE. The image does not include constraints.
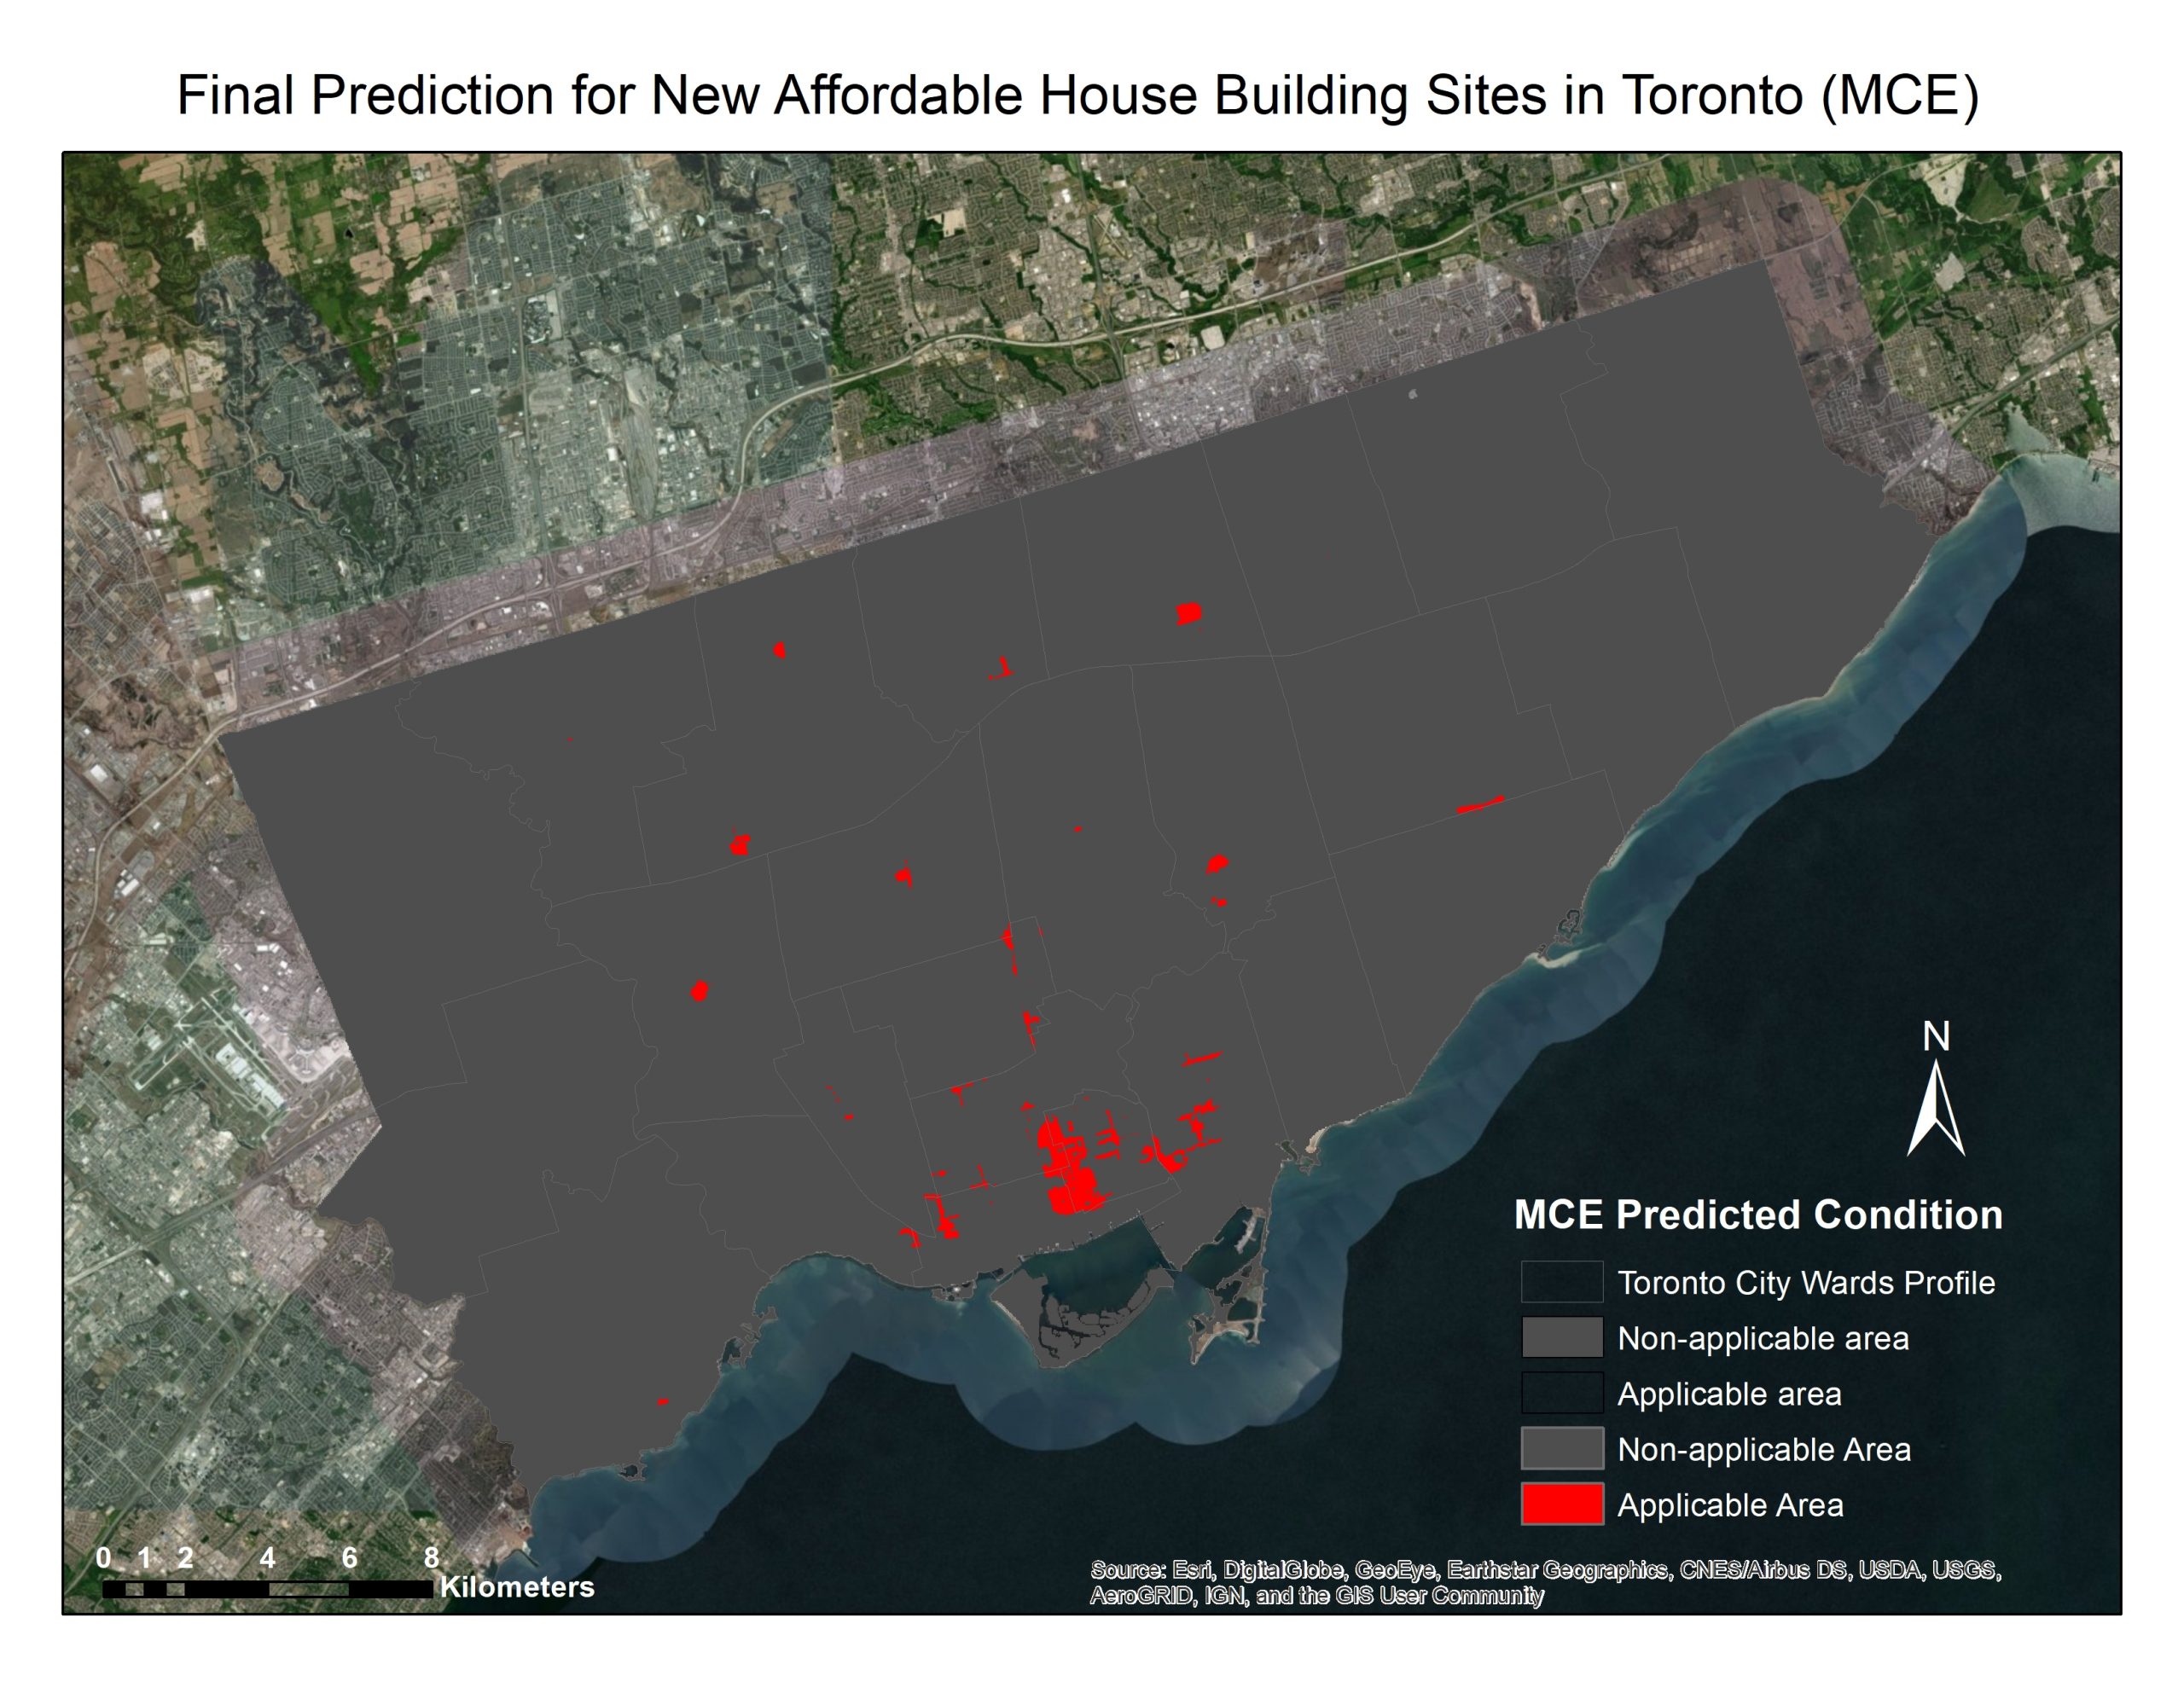
Figure 2: The prediction for potential affordable housing locations after applying constraints and based on increasing the number of affordable housing by an additional 10% using MCE
Figure 2 shows the most applicable area for building new affordable after applying constraint. This shows the results after applying constraints to figure 1 zoning areas (based on current Zoning By-law 569-2013) that are not applicable to affordable housing construction. It shows the areas allocated to potential affordable housing after being narrowed.
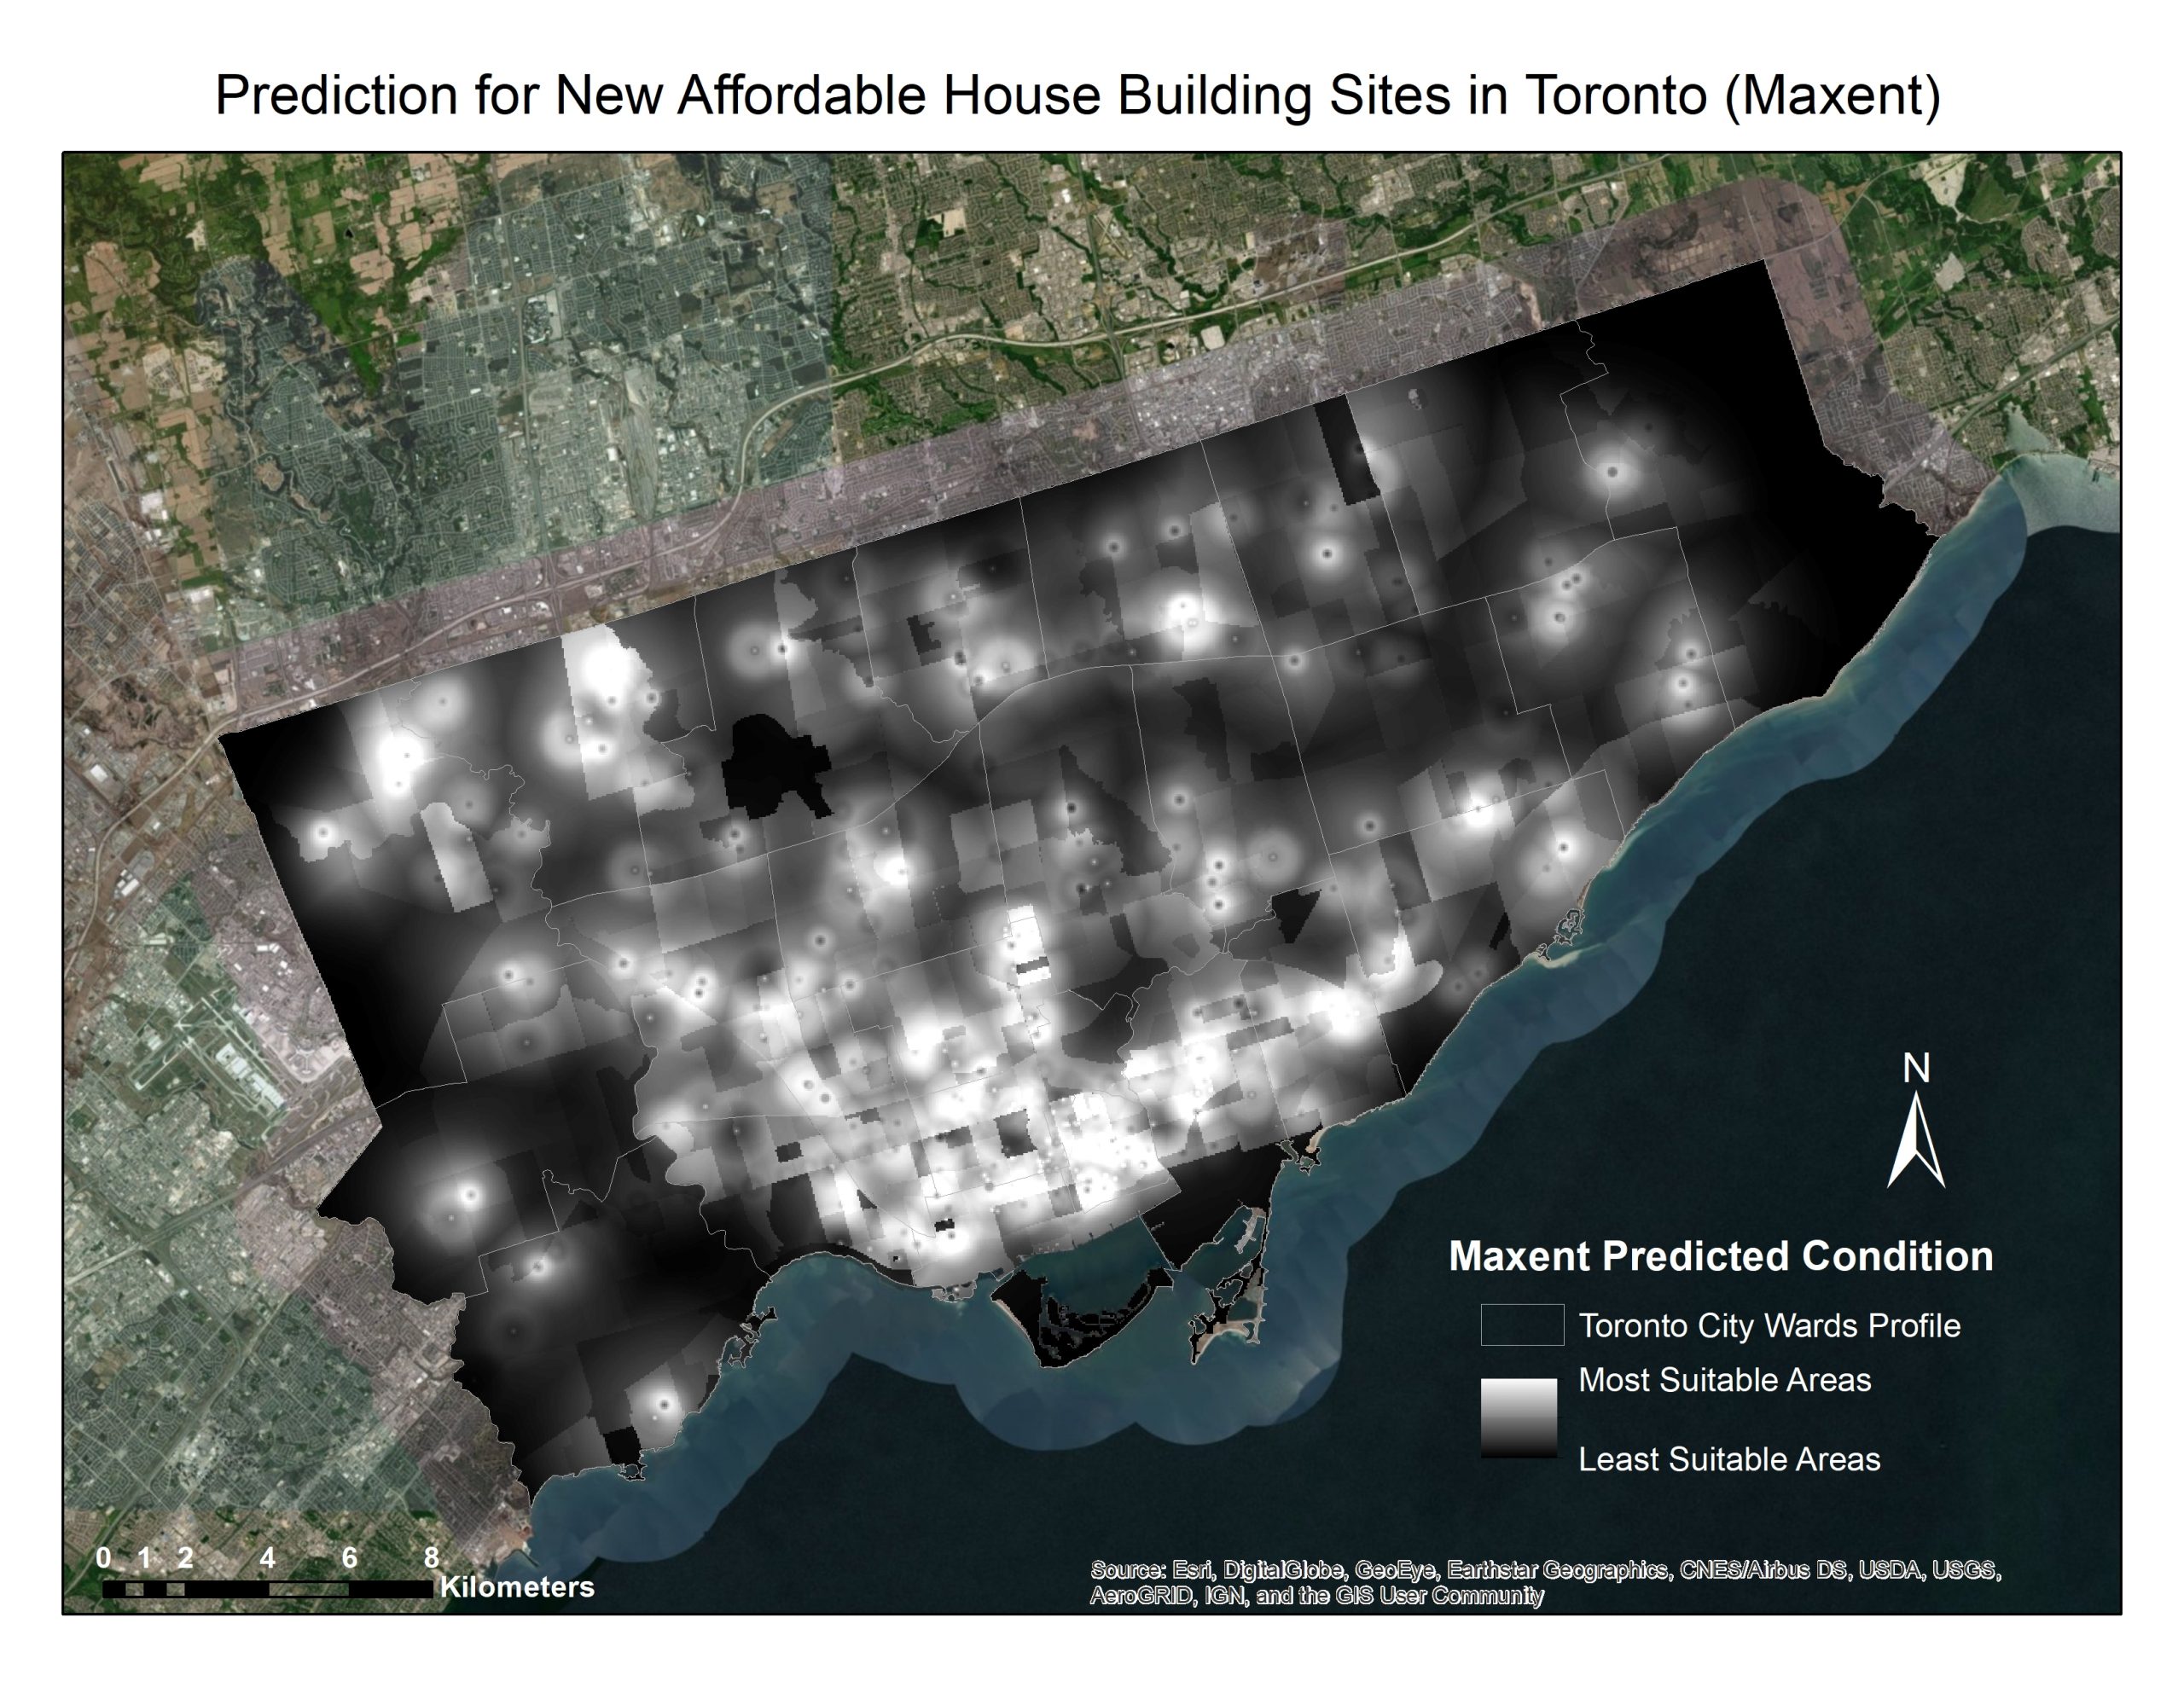
Figure 3: The prediction for potential affordable housing locations derived from the maxent model
Figure 3 provides the results of potential affordable housing locations based on the maxent output. The areas that are the darkest reflect the least suitable location for housing. The lighter color reflects more confidence as a suitable location for affordable housing based on our criteria and produced by the maxent model.
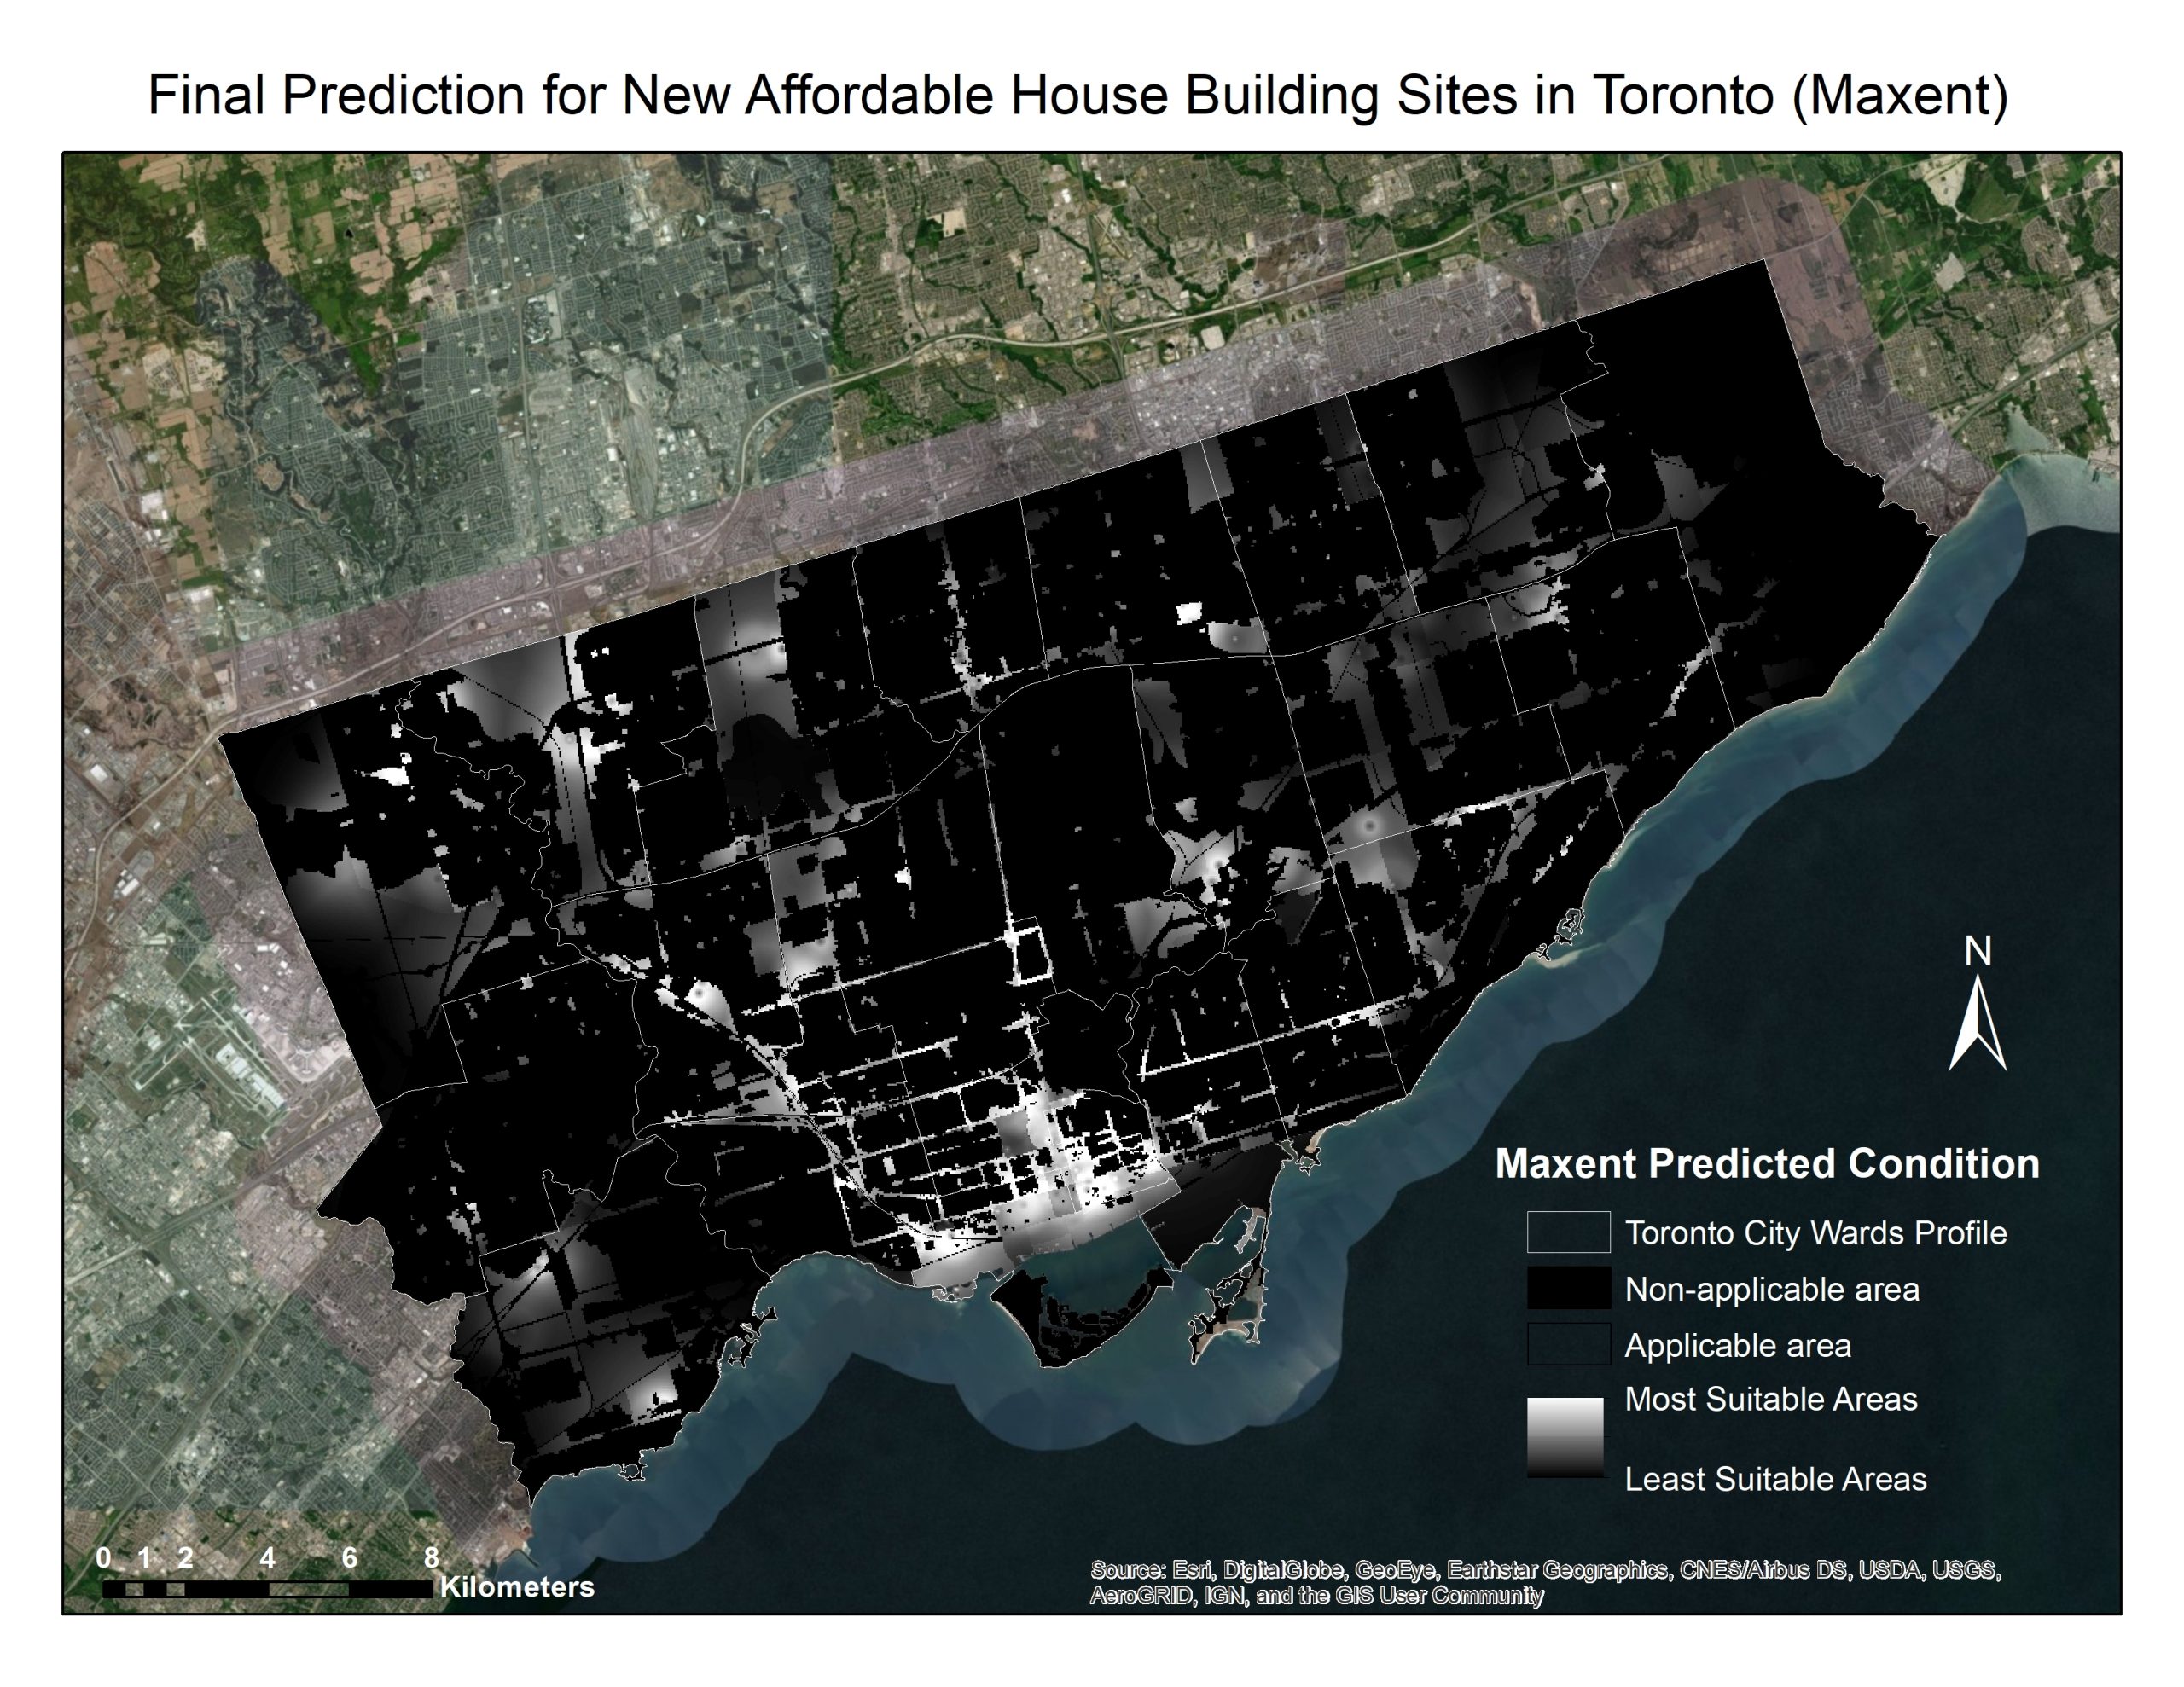
Figure 4: Final prediction for potential affordable housing locations derived from the maxent model (constraints included)
Figure 4 provides the result of our final prediction for affordable housing locations after applying constraints. The areas that are lighter reflect more confidence to be selected as an affordable housing site.
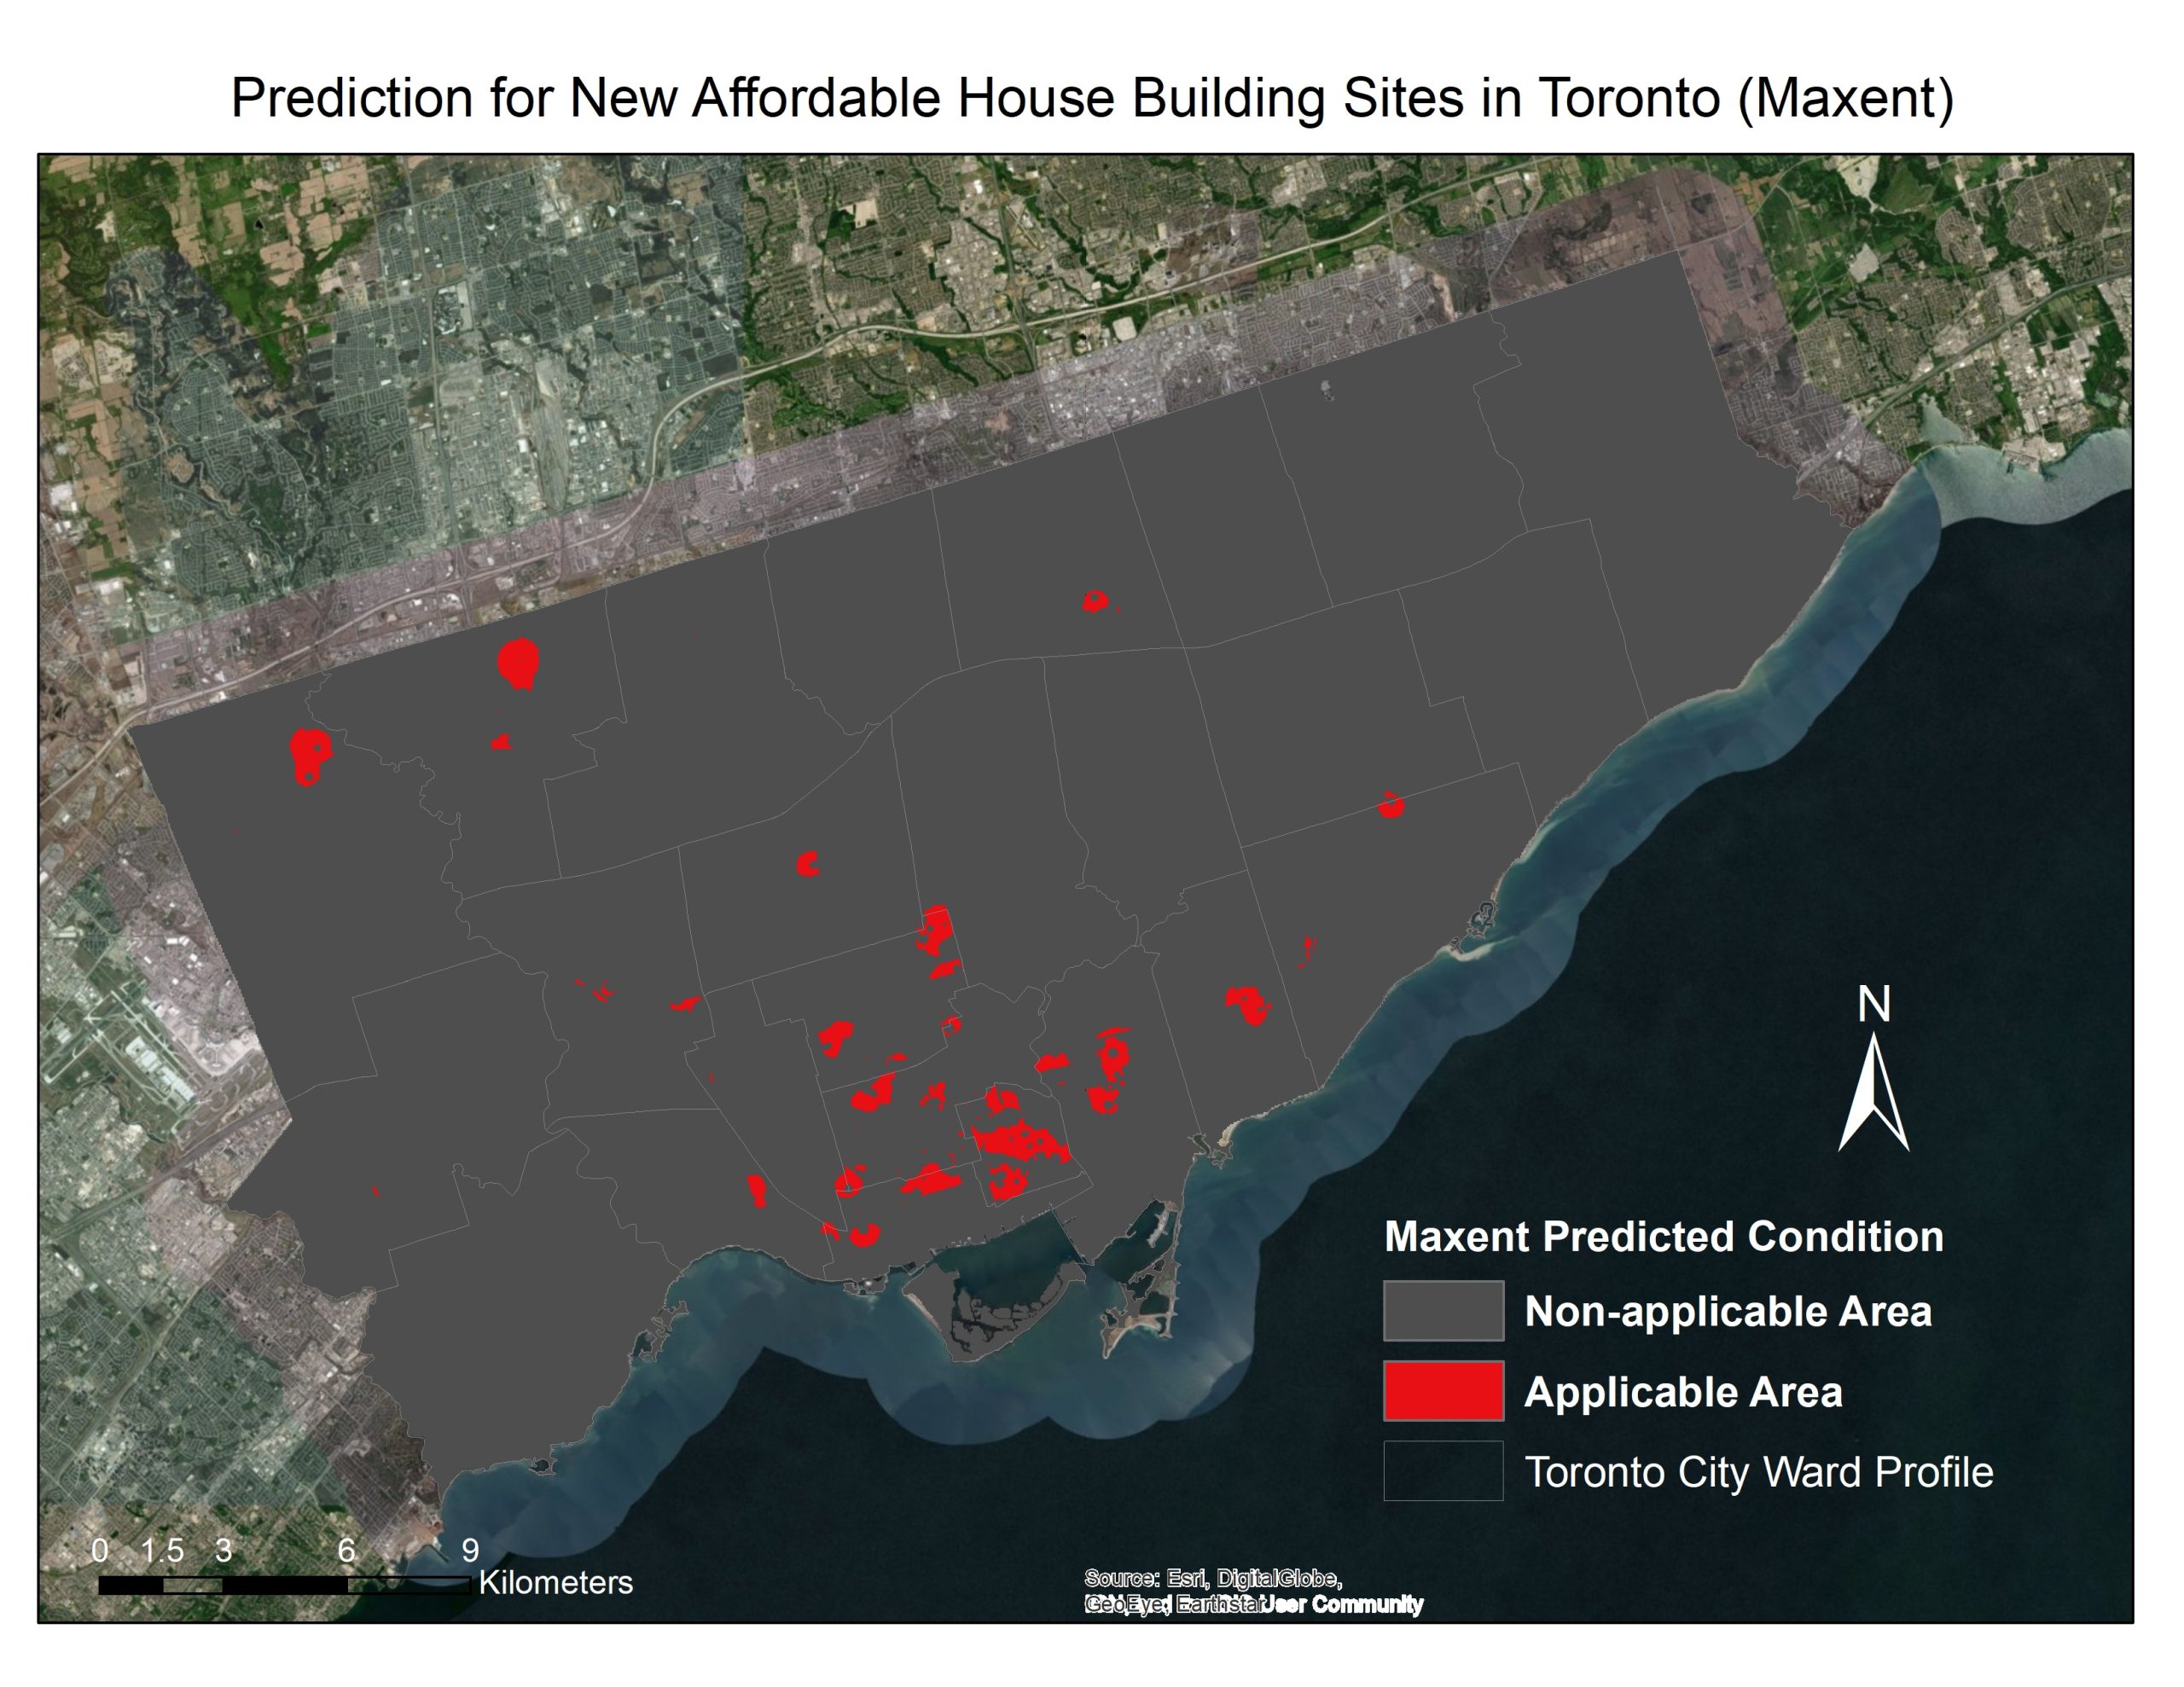
Figure 5: The prediction for potential affordable housing locations based on increasing the number of affordable housing by 500 using Maxent model and before adding constraints.
Figure 5 shows the most applicable area for building new affordable before applying constraint. This figure makes a comparison to figure 1 on the different methodology used to derive our results.
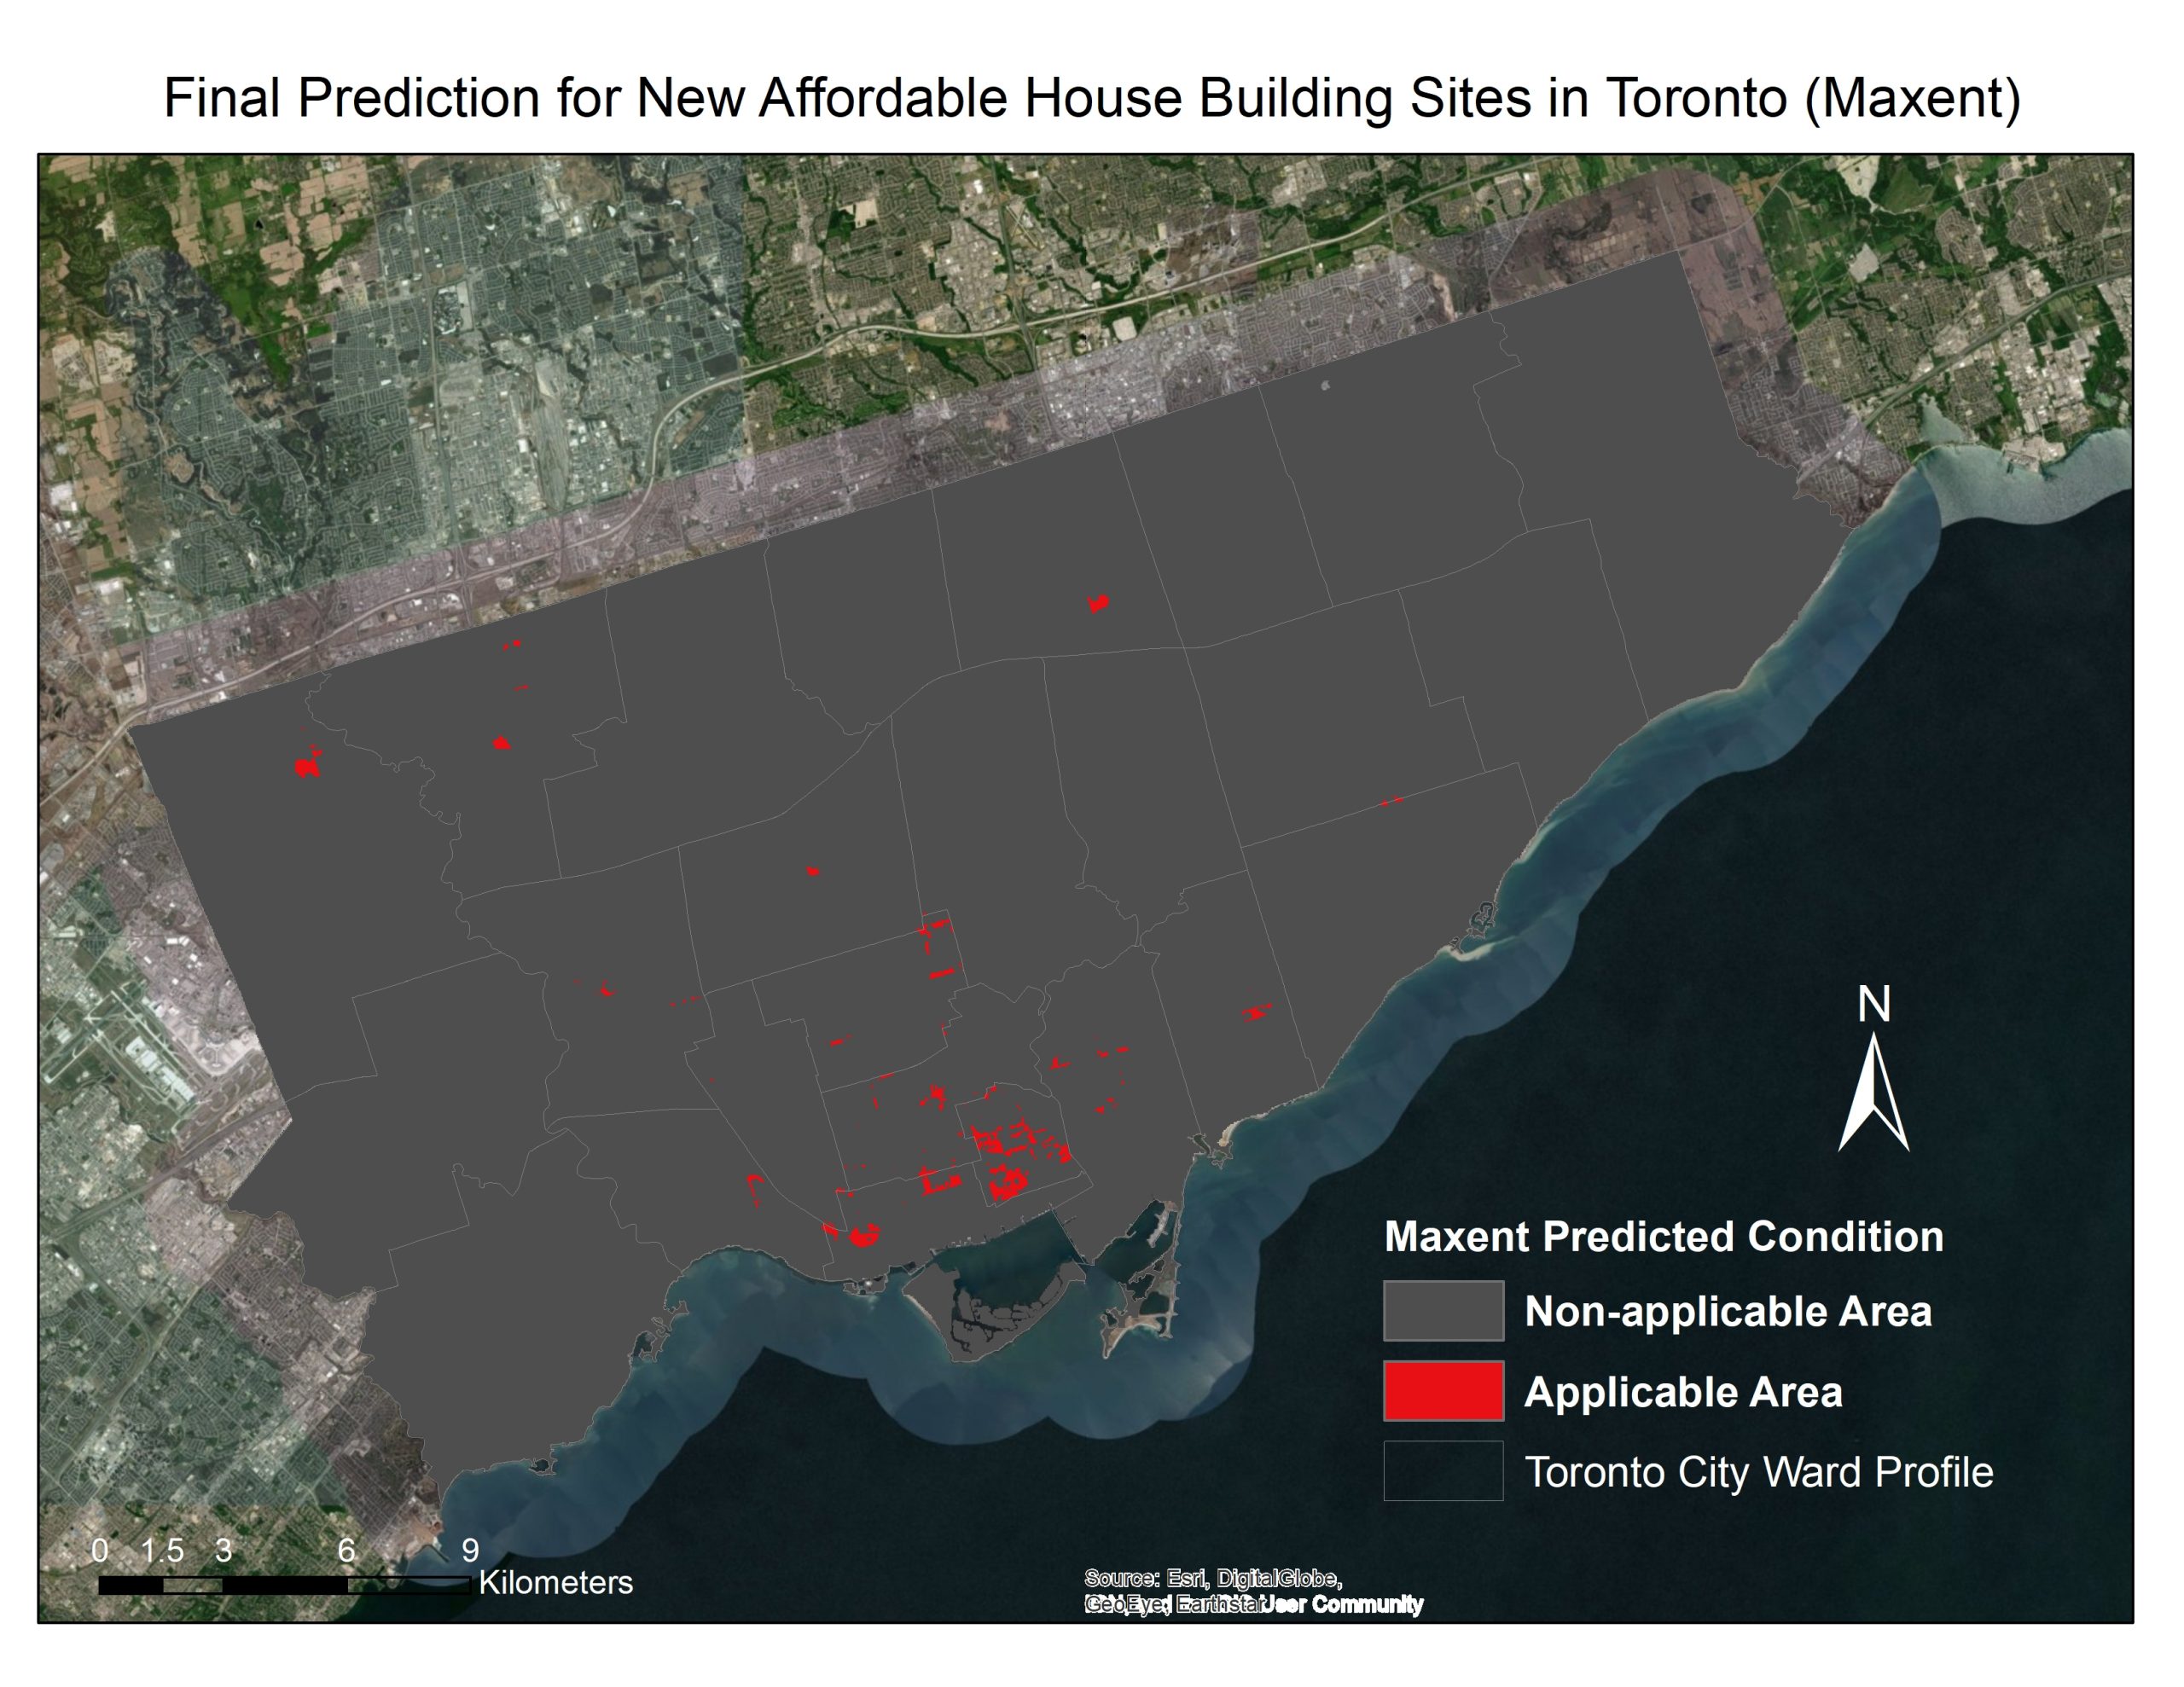
Figure 6: The prediction for potential affordable housing locations based on increasing the number of affordable housing by 500 using Maxent model and after adding constraints.
Figure 6 shows the most applicable area for building new affordable after applying constraint. This shows the results after applying constraints to figure 5 zoning areas (based on current Zoning By-law 569-2013) that are not applicable to affordable housing construction. It shows the areas allocated to potential affordable housing after being narrowed.
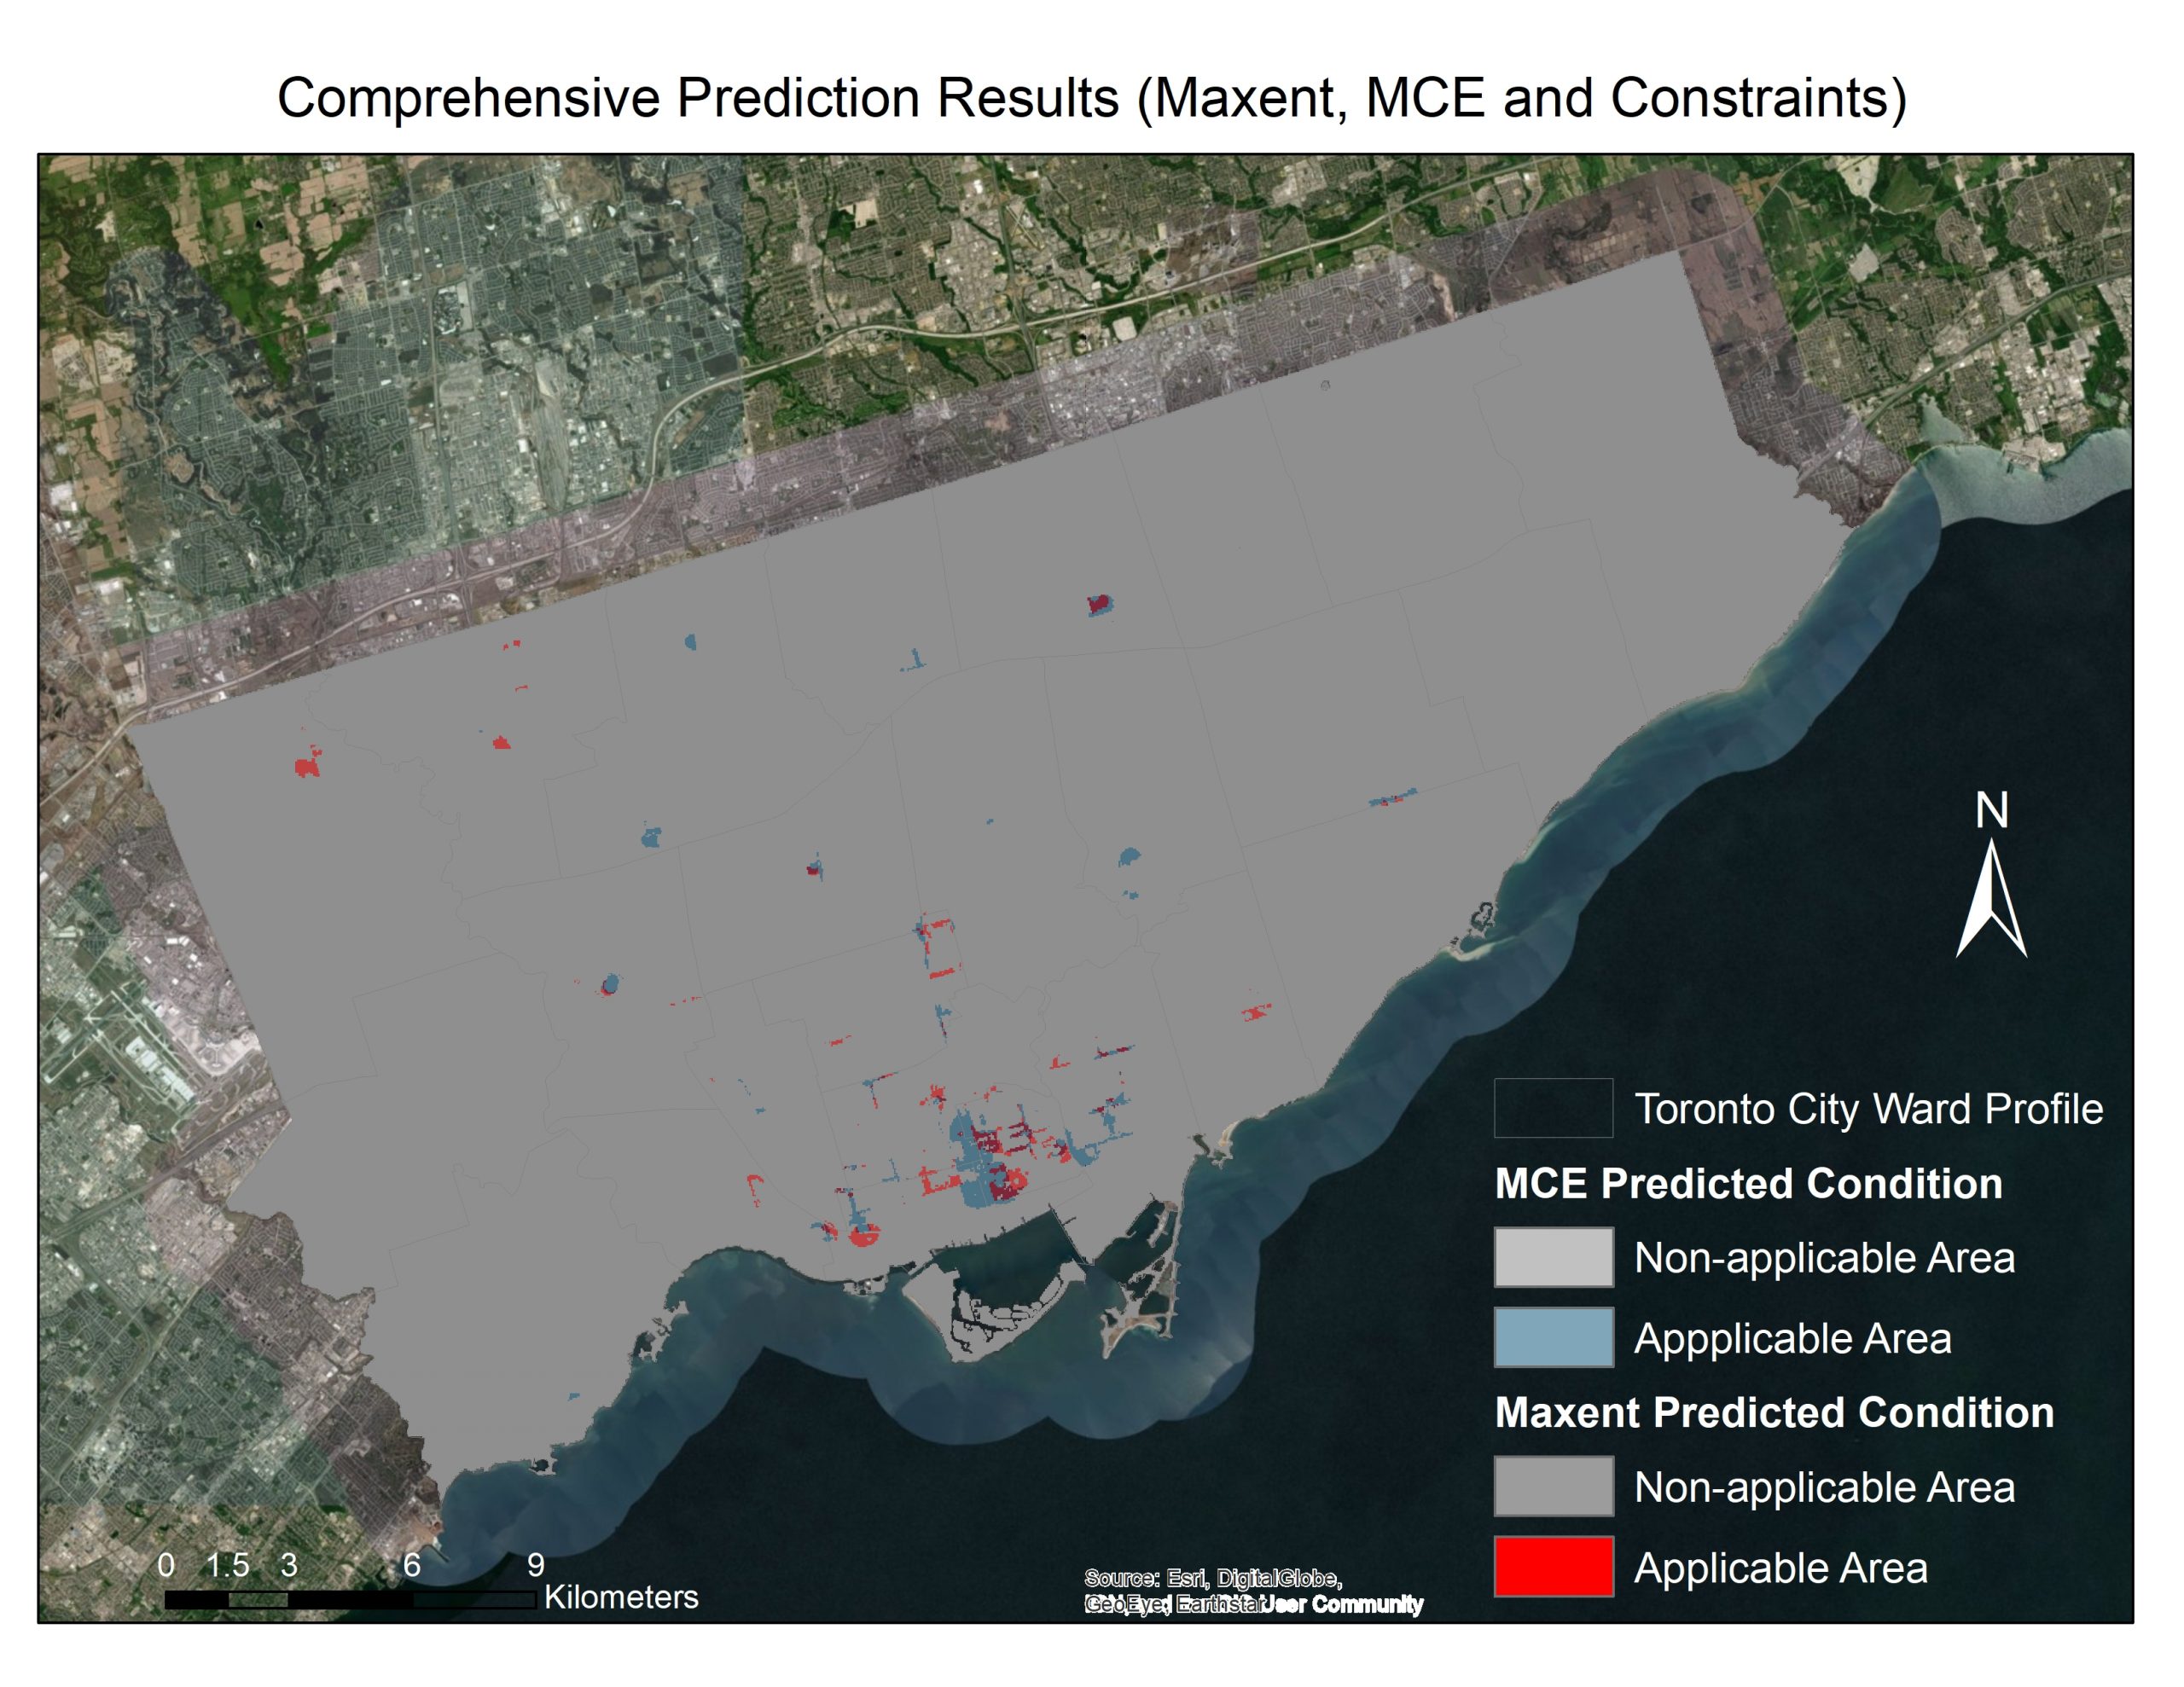
Figure 7: The prediction for potential affordable housing locations by overlaying the MCE, Maxent and constraints
Figure 7 is a comprehensive demonstration by combining the two final predicted results (MCE and Maxent) with constraints we identified. The blue-red overlay indicates area that is applicable in both models.