Learning Analytics is the measurement, collection, analysis and reporting of data about learners and their contexts, for purposes of understanding and optimizing learning and the environments in which it occurs
The Society of Learning Analytics Research (SoLAR)
Learning Services at UBC Sauder is on a never-ending journey to increase our capacity to collect, measure, and analyze learning data, all in the service of more informed teaching and learning decision-making across the school and, ultimately, faculty and student success.
The research and practice of learning analytics continue to evolve in the presence of learning technology environments. These digital environments create “trace data” (i.e., records of activity) that will never show the whole picture about the learner experience but can be useful nonetheless. Techniques and tools developed in the field of learning analytics provide insights that allow continuous improvement of teaching and learning.
Examples of How We Can Help
- Guide the process of embedding data-driven decision-making into current teaching practices
- Help explore what data is available to answer questions about teaching and learning in courses, cohorts, and programs
- Suggest practices in course design and tool selection that will provide data that answers questions about teaching and students
- Develop reports to make sense of existing but disparate data or to extend the reporting built-in to Canvas
Our Approach
We believe in helping you answer questions about your students and courses, and do so in various ways. We can help you understand what tools are currently available at UBC, such as:
When Sauder instructors have new questions, we work with them to determine: what data is (or isn’t) available from Canvas, how to access that data, and what it can (or can’t) tell you. This may take the form of a quick conversation, one-off analysis, or developing a pilot project to answer your specific questions.
We believe in an iterative approach to Learning Analytics that allows us to help you answer your questions and where possible develop tools that will help others answer those same questions as well. Wherever possible we believe in an open-source approach to the development of our tools. Below are two examples of projects where we have expanded from an individual question to the development of dashboards that may provide useful insights into student activity.
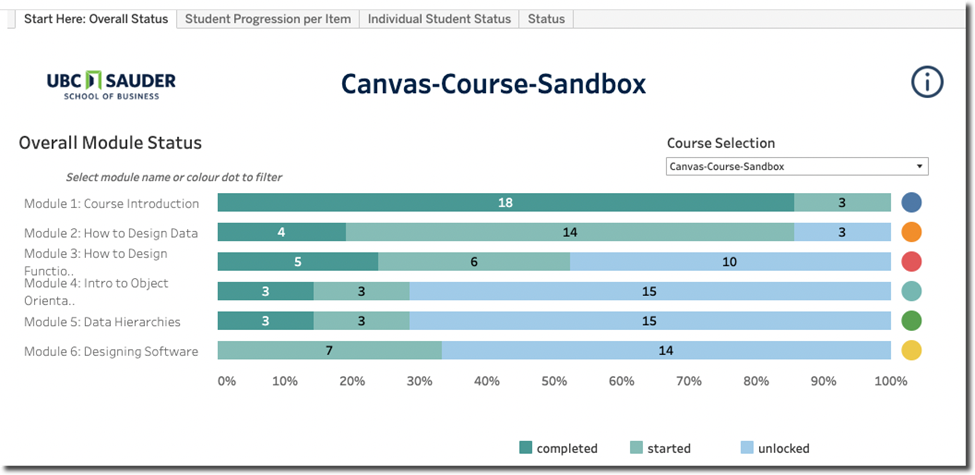
Canvas Module Progress
With Canvas, you can create module requirements and track student progress through Canvas Module Progress. However, the Canvas interface only allows you to view the progress of individual students and not the entire class. In this case, we have developed a dashboard to view student progress at the individual level or the class level.
An interactive demonstration version of this dashboard is available here.
Get Help – For access to the Canvas Module Progress dashboard for your course or any questions about Learning Analytics, please contact Jonathan Bird, Learning Services Learning Eco-Systems Support and Solutions Manager at jonathan.bird@sauder.ubc.ca
Video Analytics
If you use Panopto for your course recordings or sharing media with your class, we are working to develop useful dashboards and visualizations to analyze and understand student engagement. This project is still in the development phase, but we would be happy to collaborate to improve our existing tools alongside you and to explore what questions you may want to answer about student engagement with your videos.