
To propose new car share locations for all companies, we first need to see whether or not our hypothesized factors are within a decent distance from a parking location. In the Metro Vancouver Car Share Study – Technical Report (Metro Vancouver, 2014), a survey showed that the majority of users believe an acceptable walking duration to a car share spot is about 8 min or 600m. This distance will be incorporated into a buffer around our factors that we believe to be beneficial for car share users, which include:
- Health care clinics and hospitals
- Hello BC Tourism Activities and Attractions
- Transit stops/hubs
Using the Buffer tool (in Analysis – Proximity), a 600m buffer around each point was created for each of these three layers. The buffers were not dissolved to preserve attributes and was run under the Geodesic method to preserve shape.
The three buffers were then merged to create an overall Point of Interest (POI) layer for use by using the Merge tool under Geoprocessing.
In order to see how many parking locations are already located within 600m from any POI, a spatial join (Under Analysis – Overlay) between the two layers (merged parking locations and overall POI buffers) must be done. The join operation “JOIN ONE TO ONE” was chosen, along with an intersect match option. With this, we are able to produce a layer, called Parking_to_buffer_merge, with a “COUNT” field within its attribute table, identifying how many parking locations are within each buffer.
Since we are looking to propose new parking spots for the companies, POI buffers where there are no parking spots within are needed. We assume that ideally, at least one parking spot should be located within a 600m radius from the POI feature. To achieve this, attributes were selected where the “COUNT” field within the spatially joined layer equaled zero. Out of 499 buffers, 238 had no car-share parking spots within it. These selected buffers were then exported as a new layer, called Buffers_ZeroCount (Figure 7 ).
To ease our analysis in the future, overlapping buffers were manually merged to reduce the number of attributes in the table. We assume that any buffers are considered overlapping if their boundaries come into contact. Using the Editor tool, overlapping buffers were highlighted, then merged. The resulting location attribute to assign to these new merged buffers were chosen by evaluating which of the POIs were most commonly known or frequently visited.
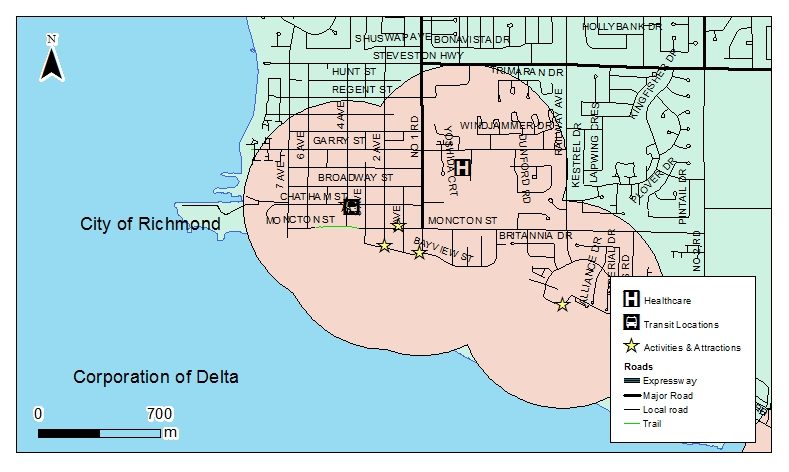
FIgure 7. Example of POI buffer merged. Original points of interest such as healthcare, transit locations and attractions are overlay on top of the buffers to show their relative locations. Projection: NAD 1983 UTM Zone 10N. Data Source: Data BC, DMTI Spatial Inc., Metro Vancouver Open Data Catalogue, Geography G Drive.