Beginning in 2011, the City of Vancouver proposed a decade-long implementation titled, “The Greenest City Action Plan”, in an effort to place Vancouver at the head of urban sustainability, and attempt a meaningful response to public outcries towards ongoing climate emergencies. This plan centered the rapid implementation of forward-thinking sustainability measures such as local food growth, new green operation facilities, and zero waste initiatives in order to shape Vancouver into an ideal city to live, grow, and work within. An area that is of concern, however, are the ways in which the benefits of this plan may not be equitably distributed amongst the city. As highlighted by scholar Amita Baviskar, sustainability initiatives made by large-scale entities such as the municipal government hold the tendency to direct them away from marginalized or underprivileged neighbourhoods such as poorer or racialized regions. This poses an issue when considering the deep interconnectedness of social location and sustainability, and how on average, marginalized regions with less access to adequate infrastructure and resources are found to disproportionately brace the brunt of climate disasters (Baviskar, 2018, p.88). Despite the “Greenest City” action plan closing in 2020, it had failed to meet a majority of its sustainability targets. This indicates to us that there is still much to be done regarding Vancouver’s commitments to green initiatives.
There are four categories of projects: City projects, City Studio projects, Greenest City Fund projects, and Private projects, each assigned to one of the 10 Greenest City objectives. To be considered, a project must be large-scale, in Vancouver, initiated after the founding of the Greenest City Action Team (2010), and contribute to a Greenest City goal. From the dataset we are planning to use, there are currently 324 records of Greenest city projects within Vancouver. This is inclusive of community gardens created since 2010 (though not all), and other initiatives such as publicly-accessible electric vehicle charging stations. This decade-long effort to make Vancouver a “greener place to live, work and play” has shown significant progress over the years (City of Vancouver 2021). Despite not meeting all 18 of the goals within the Greenest City 2020 Action Plan (GCAP), Vancouver was able to accomplish 8 out of 18 of its targets.
We believe that any amount of progress is still considered progress. Hence, with exacerbated effects of climate change in more recent years, the increased amount of social engagement and movement fighting for climate change action locally and globally presents an opportunity to further develop the scale of Vancouver’s Greenest city projects. Our project advocates these prevailing concerns related to climate change and with decreasing open land area which can be utilized for these sustainability initiatives or projects, it is important to look into alternatives to promote sustainability practices within urban environments. With increased pressure for cities to adapt, analyzing the geographical distribution of current Greenest City projects combined with some suggestions of areas that can be further developed to build or implement Greenest City projects would aid in accelerating Vancouver’s progress to becoming a leader in urban sustainability.
Our project aims to provide the first steps in advocating for equal climate resilience within Vancouver by assessing the spatial relation between marginalized populations and sustainability projects. By recognizing its potential presence within Vancouver, we work to bridge these gaps through the proposal of an expanded “Greenest City” projects implementation that can provide easy, accessible opportunities for sustainable community engagement. Our research will be focused on the Vancouver city region (see Map 1) and will revolve around the following guiding questions:
- How does the prevalence of marginalized populations spatially affect the placement of “Greenest City” projects?
- Are our chosen variables weighted equally? If not, which has held the most influence?
- Based on areas that are statistically lacking “Greenest City project” accessibility, where should we propose new implementations?
Explanatory variables we have chosen to compare “Greenest City” projects to are: income, population density, level of educational attainment, and visible minority population. The reasoning for this is that all four variables on a sliding scale can indicate the level of privilege and or marginalization that an area faces. Spatial analyses with these variables considered are measured by Census Tract (CT) boundaries. This allows for the maximum opportunity to catch Greenest City projects within neighbourhoods, given that complicating the data too much with smaller Dissemination Areas will likely lead to a majority of neighbourhoods not containing a “Greenest City” project within its borders.
In proposing potential sites and areas which could be further developed for the implementation of new Greenest City Projects, we are taking an interdisciplinary combination of both a GIS analyst (geoanalytical) and an urban planner design (non-computer based) approach to our work. Utilizing this approach will not only rely on quantitative results from the analyses we have conducted, but aim to advise accordingly from qualitative results and our knowledge about the Vancouver area. Final recommendations will be done through annotations and sketchings to identify which areas we think are developable and most suitable to implement Greenest City Projects.
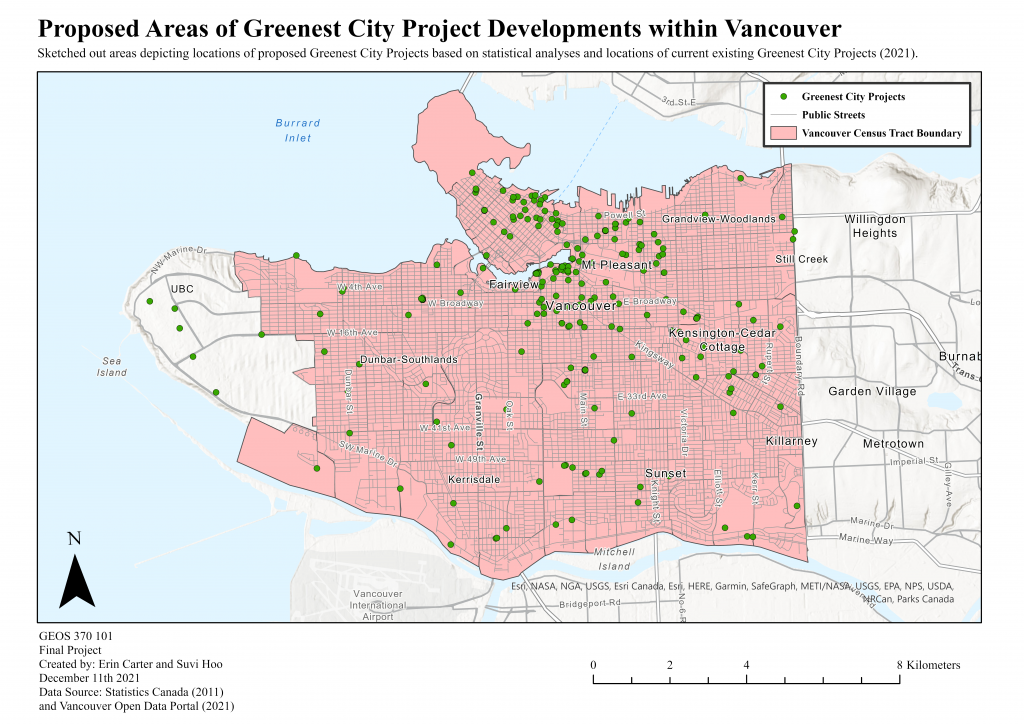 Map 1: The base map of our study area