Planning for a Tsunami
In lab 3, I learnt how to review data for geographic analysis and perform basic geographic analysis (buffer proximity analysis, reclassify raster layers, convert raster to vector data files, combine vector data layers with polygon overlay tool intersect, perform a proximity analysis using select by location, extract datasets with the polygon overlay tool clip). I learnt about the high risk areas, infrastructures and land use in the City of Vancouver by combining different Tsunami risk assessment data layers onto one map and highlighting neighbourhoods at risk. I have also analysed tabular datasets and calculated statistics of Vancouver’s land use, roads and important facilities that would in danger under a possible tsunami event.
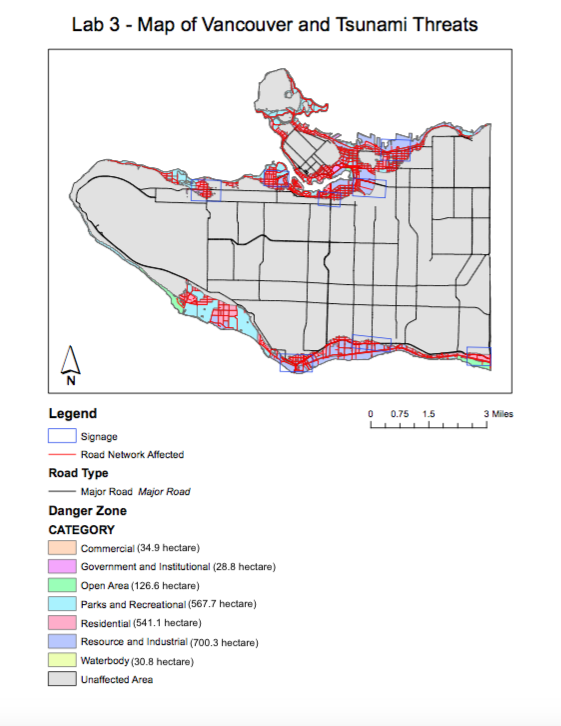
The map below is the map I created through this lab:

Through statistical calculation, the total area of the City of Vancouver (including University Endowment Lands) at risk during a potential Tsunami event is approximately 2030.2 hectares, or 15.5% of the total assessed land area.
The major health and education facilities at risk during a potential Tsunami are as follows:
- FALSE CREEK RESIDENCE
- BROADWAY PENTECOASTAL LODGE
- COAST WEST COMMUNITY HOME
- YALETOWN HOUSE SOCIETY
- VILLA CATHY CARE HOME
- ST ANTHONY OF PADUA
- ECOLE ROSE DES VENTS
- HERITAGE 3R’S SCHOOL
- VANCOUVER MONTESSORI SCHOOL
- FALSE CREEK ELEMENTARY
- EMILY CARR INSTITUE OF ART & DESIGN (ECIAD)
- HENRY HUDSON ELEMENTARY
- ST JOHN’S INTERNATIONAL
- ST FRANCIS XAVIER
- INSTITUTE OF INDIGENIEOUS GOVERNMENT (IIG)