Housing Affordability
In lab 4, I worked with census data and made use of tables, joins, classification, normalisation, and visualisation in order to develop a deeper understanding of housing affordability in Canada, specifically, Vancouver and Ottawa.
The learning objectives include:
- Developing a working knowledge of Canadian census data
- Understanding quantitative data classification
- Working with ratios to compare datasets, and normalising data to determine housing affordability
- Creating maps of GIS analyses results
Quantitative Data Classification
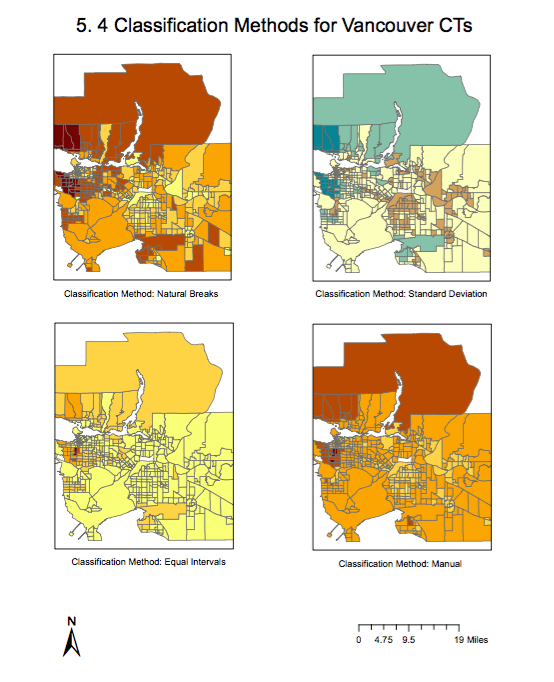
There are four quantitative data classification, namely natural breaks, equal interval, standard deviation, and manual breaks. The image below shows how the different quantitative data classifications will result in differing outputs regarding housing costs in Vancouver, and thereby influencing the interpretation of data on maps. Depending on the purpose of the map, different quantitative data classifications can be used to suit the needs of the creator, to influence how the audience reads the data.

Housing affordability
Housing affordability is the ratio between a family’s median income and the average housing cost. This indicator is better than using housing cost alone as it takes into consideration the different income levels between cities and census tracts.
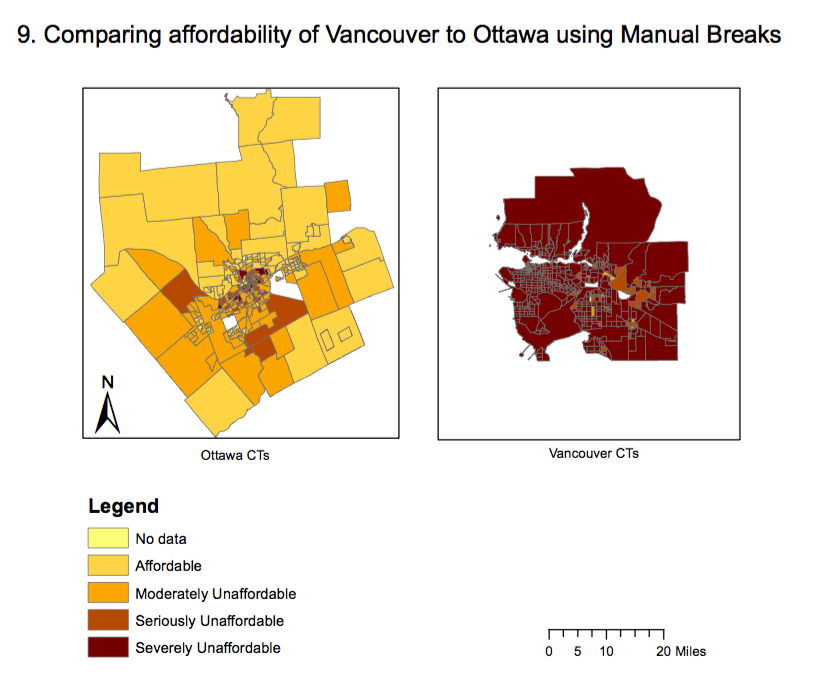
There are four categories with regards to housing affordability ratings. If the median multiple is under 3.0, it would considered as affordable housing; 3.1-4.0 is moderately unaffordable, 4.1-5.0 is seriously unaffordable and 5.1 & over is severely unaffordable. The image below compares the housing affordability ratings between Vancouver and Ottawa.

This rating system is created by the 12th Annual Demographia International Housing Affordability Survey. The data may not be fully accurate, and should not be ‘trusted’ completely as it may be manipulated by different organisational groups for various purposes. The maps of housing affordability may be very different based on the classification method used.
Is affordability a good indicator of a city’s ‘liveability’? While housing is in fact an important aspect of life in a city, it should not be the sole indicator of the city’s liveability. Liveability can be defined loosely as the quality of life. As such, a city’s liveability should also consider cost of living, accessibility of public services, lifestyles, green spaces etc.