Through GEOB 270, I have learnt a lot about GIS. When I first heard about GIS, I brushed it off, thinking that it was irrelevant to me, even though I was a Geography major. My next encounter with GIS taught me how useful GIS was – my friends actually collected their own data in Thailand and developed their thesis based on this data and represented it visibly on a map using GIS. This sparked my interest and I wanted to learn more. GEOB 270 allowed me to fully understand the basics of this amazing technology. I am able to perform basic GIS analysis such as sourcing spatial datasets online, to parse and filter them, to fix misaligned and improperly referenced data, and to make effect maps to display my research findings.
Category: GEOB270
Final Project
- Project summary: proposal and goal
For my group’s final project, we decided to look at the livability of British Columbia. As it is not possible to measure livability directly, we used air quality as an indicator. The aim of the project is to answer the research question: how will the presence of industries and road traffic affect the air quality, and therefore, the livability of residential areas in BC. Through the use of GIS, the air quality of BC can be mapped and correlated with residential areas to determine its livability. With this information, areas with substandard air quality and livability can be encouraged to take action to improve their situation.
- Project management
The project was carried out as a team. After coming up with a research topic and having our proposal approved, we came together to divide the work. By doing so, each of us could wholly focus on one aspect of the project and do a good job at it. After the completion of the report, we came together once more to check through and ensured that there was a flow in the report.
- What I have learnt
I have learnt a lot from this project. For one, I learnt that while there is a lot of data available online, not all data is good data. It took some time to sieve through and filter through the available data and to finally decide which datasets are useful for our project.
Through this project, I have also become more comfortable with using ArcGIS, of which I found really confusing initially.
I have also gained a lot from working in a group under a tight schedule. We did not have the luxury of time to complete this project and communication in our group was not the best. It was an interesting experience dealing with this. Nonetheless, it was a fulfilling learning experience.
GEOB 270 Lab 5
In this lab, I learnt how to acquire spatial datasets online, parse and filter data based on analytical objectives, evaluate and use different spatial analysis tools, and developed my cartographic and written communication skills by producing a map and short memo summarising my results for a non-technical audience.
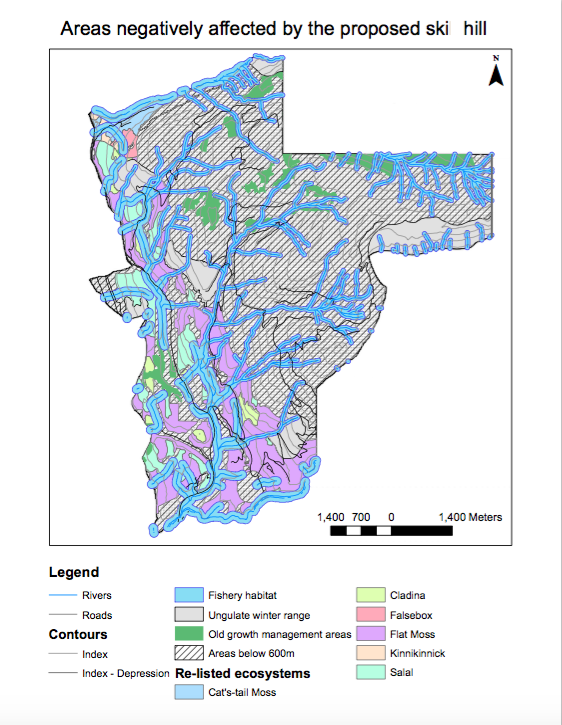
Map showing areas negatively affected by the proposed ski hill:
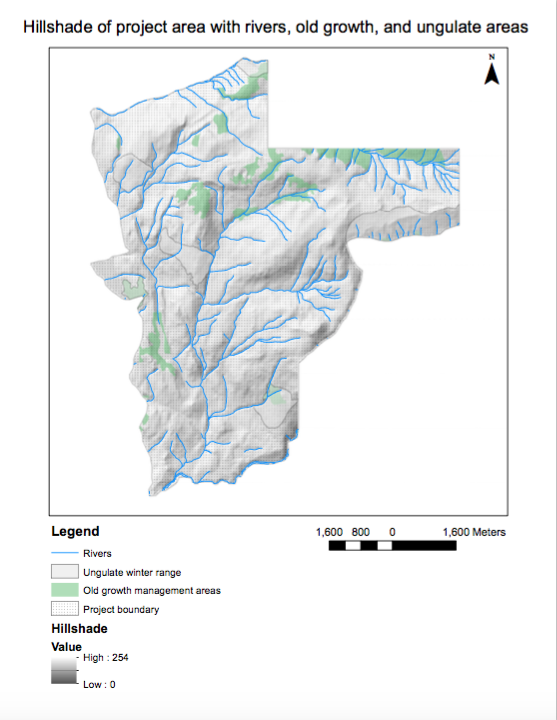
Map showing hillshade of project area with rivers, old growth and ungulate areas:
Memo:
The British Columbia Snowmobile Federation (BCSF) is a province-wide organisation of over 45 snowmobile clubs and grooming societies. The federation is focused on safety, the growth of the sport, protection of the environment and securing access to public lands for all. Since its inception in 1965, the BCSF has been campaigning for the preservation of riding areas, as well as conservation and the careful use of BC’s backcountry.
The Garibaldi at Squamish project is a proposed year-‐‑round destination mountain resort on Brohm Ridge. As of January 2016, this project has been tentatively approved, with 40 conditions and includes 124 ski trails and 21 lifts, resort accommodation and commercial developments.
As a natural resource planner, engaged by BCSF, and my job is to examine the Environmental Assessment’s recommendations and Whistler’s criticism to evaluate whether there is sufficient evidence to continue to oppose the Garibaldi at Squamish project, or whether these environmental concerns can be addressed as part of the project.
It is understood that the project proponents (Northland Properties and Aquilini Investment Group of Vancouver) submitted an application for a Project Approval Certificate under the Environmental Assessment Act in 1997. Subsequently, in 2010, the BC Environmental Assessment Office released a report stating that the Garibaldi at Squamish project lacked information on the potential effects on vegetation, fish, and wildlife habitat, and recommended a series of measures to prevent or reduce any significant environmental, social, economic, heritage and health effects. In April 2015, the project proponents filed a supplemental application that they claimed addressed these issues. During the subsequent community consultation process in May and June 2015, the Resort Municipality of Whistler submitted a letter opposing the project. In addition to its concerns over the economic viability and impact of the project, Whistler questioned the possibility of reliable skiing on the lower 600m of the vertical, considering the climate of the area and climate change.
To address the Resort Municipality of Whistler’s concern about the possibility of reliable skiing on the lower 600m of the vertical, given the climate of the area and climate change in the 21st century, I have used Geographical Information Science (GIS) and calculated the area of the project area that is below 600m. Through my analysis, it is observed that 31.8% of the proposed project area is on the lower 600m of the vertical. This is quite a significant area of the project that may not be suitable for skiing as there will not be enough snow there.
To verify the Environmental Assessment of the project area, I used GIS to calculate the area that will be negatively affected by the proposed ski hill. In order to accomplish this, I retrieved data regarding ungulate winter range, old growth management areas, project boundary, areas with red-‐‑listed ecosystems, elevation, parks and protected area boundary, roads and rivers of the area. GIS allowed me to overlay these data and produce a map to highlight the areas that will be negatively affected by the project. The project will affect areas with old growth forests, areas of Mule Deer and Mountain Goat winter habitat, areas with red-‐‑listed ecosystems, and areas that fall within fish bearing streams or within fish habitat/riparian areas around streams.
From the map produced (refer above), it is clear that 65.8% of the project area will be negatively affected by the project. Specifically, 6.78% of the project area has old growth forest, 7.89% has Mule Deer and Mountain Goat winter habitat, 24.8% has red-‐‑ listed ecosystems, and 26.3% of the project area will fall within fish bearing streams, or within fish habitat/riparian areas around streams. As such, it is observed that the two greatest environmental concerns to the project development is its effect on red-‐‑listed ecosystems and the river systems in the area.
As a natural resource planner, I believe the best way to mitigate this environmental impact is to reduce the area of the project, specifically the southwest region of the proposed area. The southwest region of the project area has the greatest density of red-‐‑ listed ecosystems and river systems of the area.
In conclusion, the proposed ski hill will have severe environmental impact on the area. While it might be possible to mitigate these environmental effects, the area will nevertheless be subject to environmental damage with the development of the project. Furthermore, the project may not be economically viable either as a significant portion of the proposed area will be unable to serve its purpose as a ski hill.
Personal response:
When working on environmental projects, it is possible to be involved in proposals that I do not ethically believe in. Personally, I would not want to compromise on my own values and beliefs. If possible, I will remove myself from the project and attempt to prevent the project from happening. If this is not possible, I will try to find a middle ground. However, I recognise that this may not always be possible as everyone will be focused and vying only for their desired outcome, regardless of the aftermath of the project.
GEOB 270 Lab 4
Housing Affordability
In lab 4, I worked with census data and made use of tables, joins, classification, normalisation, and visualisation in order to develop a deeper understanding of housing affordability in Canada, specifically, Vancouver and Ottawa.
The learning objectives include:
- Developing a working knowledge of Canadian census data
- Understanding quantitative data classification
- Working with ratios to compare datasets, and normalising data to determine housing affordability
- Creating maps of GIS analyses results
Quantitative Data Classification
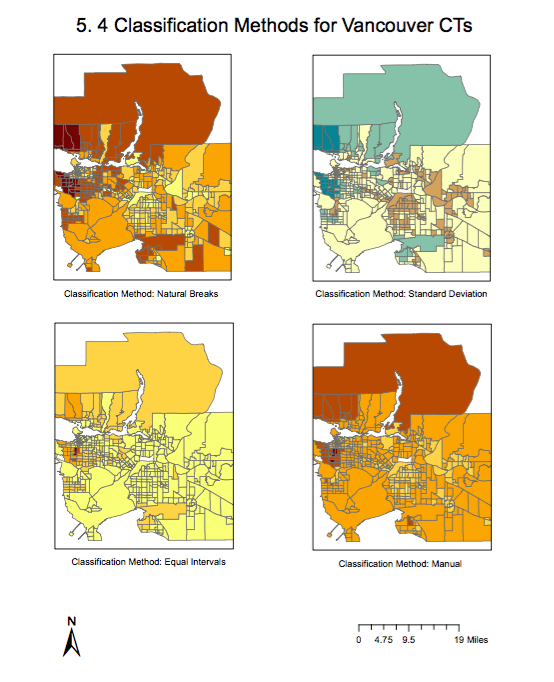
There are four quantitative data classification, namely natural breaks, equal interval, standard deviation, and manual breaks. The image below shows how the different quantitative data classifications will result in differing outputs regarding housing costs in Vancouver, and thereby influencing the interpretation of data on maps. Depending on the purpose of the map, different quantitative data classifications can be used to suit the needs of the creator, to influence how the audience reads the data.
Housing affordability
Housing affordability is the ratio between a family’s median income and the average housing cost. This indicator is better than using housing cost alone as it takes into consideration the different income levels between cities and census tracts.
There are four categories with regards to housing affordability ratings. If the median multiple is under 3.0, it would considered as affordable housing; 3.1-4.0 is moderately unaffordable, 4.1-5.0 is seriously unaffordable and 5.1 & over is severely unaffordable. The image below compares the housing affordability ratings between Vancouver and Ottawa.
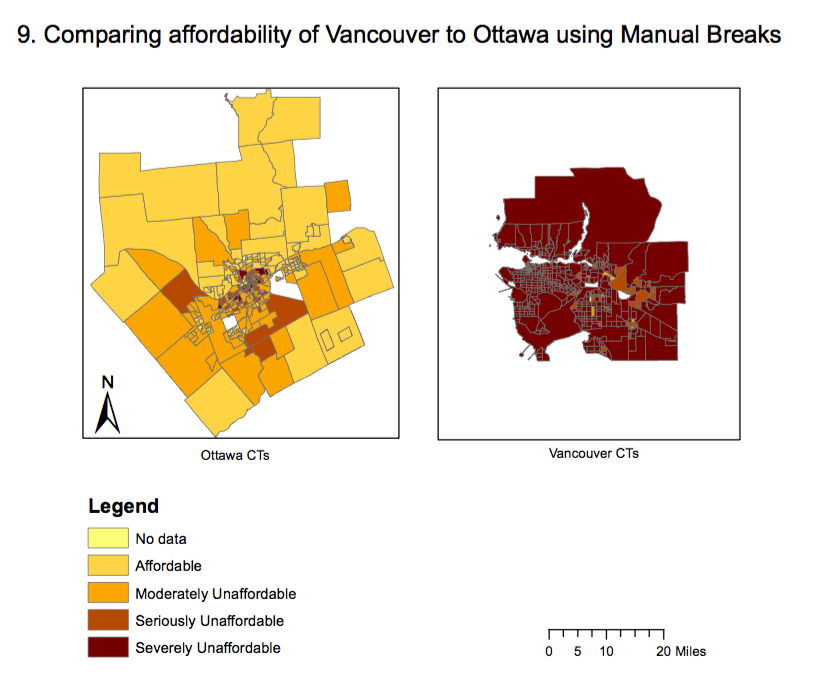
This rating system is created by the 12th Annual Demographia International Housing Affordability Survey. The data may not be fully accurate, and should not be ‘trusted’ completely as it may be manipulated by different organisational groups for various purposes. The maps of housing affordability may be very different based on the classification method used.
Is affordability a good indicator of a city’s ‘liveability’? While housing is in fact an important aspect of life in a city, it should not be the sole indicator of the city’s liveability. Liveability can be defined loosely as the quality of life. As such, a city’s liveability should also consider cost of living, accessibility of public services, lifestyles, green spaces etc.
Accomplishment Statements
Lab 1:
Gained basic knowledge of GIS and ArcGIS software which formed a primary understanding of geospatial analysis to be used in future labs and research in and after this course.
Lab 2:
Learnt about remote sensing imagery, Landsat data, and satellite imagery, which can be used to perform geographical analysis with regard to landuse and topography.
Lab 3:
Used spatial and tabular datasets understand tsunami risk in the City of Vancouver.
Lab 4:
Developed a working knowledge of Canadian census data to analyse and compare housing affordability between Vancouver and Montreal.
Lab 5:
Learnt to acquire datasets from online sources and composed a short memo summarising my results for a non-technical audience.
GEOB 270 Lab 3
Planning for a Tsunami
In lab 3, I learnt how to review data for geographic analysis and perform basic geographic analysis (buffer proximity analysis, reclassify raster layers, convert raster to vector data files, combine vector data layers with polygon overlay tool intersect, perform a proximity analysis using select by location, extract datasets with the polygon overlay tool clip). I learnt about the high risk areas, infrastructures and land use in the City of Vancouver by combining different Tsunami risk assessment data layers onto one map and highlighting neighbourhoods at risk. I have also analysed tabular datasets and calculated statistics of Vancouver’s land use, roads and important facilities that would in danger under a possible tsunami event.
The map below is the map I created through this lab:
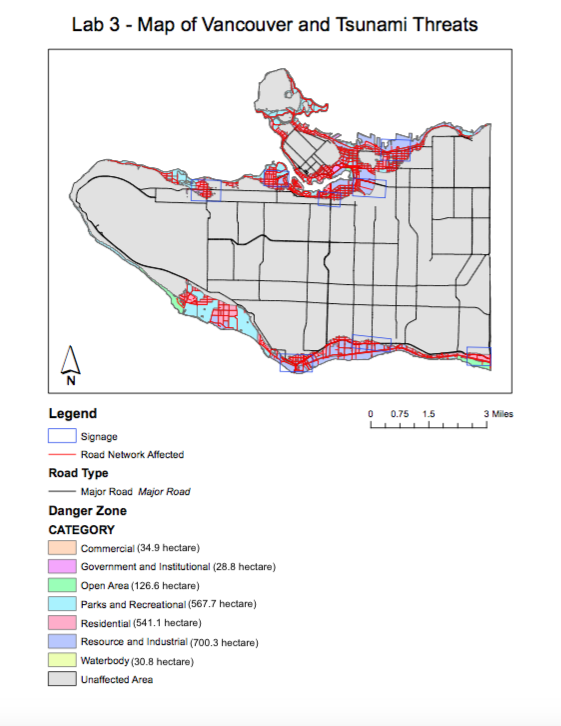
Through statistical calculation, the total area of the City of Vancouver (including University Endowment Lands) at risk during a potential Tsunami event is approximately 2030.2 hectares, or 15.5% of the total assessed land area.
The major health and education facilities at risk during a potential Tsunami are as follows:
- FALSE CREEK RESIDENCE
- BROADWAY PENTECOASTAL LODGE
- COAST WEST COMMUNITY HOME
- YALETOWN HOUSE SOCIETY
- VILLA CATHY CARE HOME
- ST ANTHONY OF PADUA
- ECOLE ROSE DES VENTS
- HERITAGE 3R’S SCHOOL
- VANCOUVER MONTESSORI SCHOOL
- FALSE CREEK ELEMENTARY
- EMILY CARR INSTITUE OF ART & DESIGN (ECIAD)
- HENRY HUDSON ELEMENTARY
- ST JOHN’S INTERNATIONAL
- ST FRANCIS XAVIER
- INSTITUTE OF INDIGENIEOUS GOVERNMENT (IIG)
GEOB 270 Lab 2
Coordinate Systems and Spatial Data Models
In lab 2, ArcGIS was used to learn about coordinate systems, datums, projections, and spatial data models (raster and vector data).
Learning Objectives:
- Managing and previewing data using ArcCatalog
- Understanding coordinate systems and projections
- Compare and contrast spatial data models
- Working with remote sensing imagery
In this lab, I learnt that for all Geographical Information System (GIS) analysis, it is important for all datasets to have the same Geographical Coordinate System and map projection. During GIS analysis, if spatial datasets have different coordinate systems and projections, the data output might be misaligned and referenced improperly. When the data is projected into a different coordinate system, the shape, area, and direction of the data are affected.
To ensure that all data layers have the same datum or coordinate system and map projection, the ‘projection-on-the-fly’ function in ArcMap can be utilised. The ‘projection-on-the-fly’ process allows one to combine layers with different coordinate systems and have them align with each other. Alternatively, the ArcToolbox Project and Transformation commands can also be used. This modifies the data and creates a new version of the data layer with a different coordinate system.
I also worked with remote sensing imagery in this lab. Remote sensing is the process of collecting information about an object or surface from afar. This is done by measuring how much a target absorbs or reflects energy when exposed to an energy source. This is the principle used in satellite imagery, aerial photography, and LiDAR.
In this lab, I used remotely sensed Landsat data for geographic analysis. Landsat is a remote sensing program which uses sunlight as its energy source and measures the response of objects and surfaces on earth.
This is advantageous for geographical analysis with regards to assessing land use and topography. Satellite imagery is also useful in monitoring erosion, assessing wildlife habitats or even changes in environmental landscape after natural disasters.