Categories
TRADING GAME Uncategorized

WEEK 10 (Part 1): The Went Right/Wrong

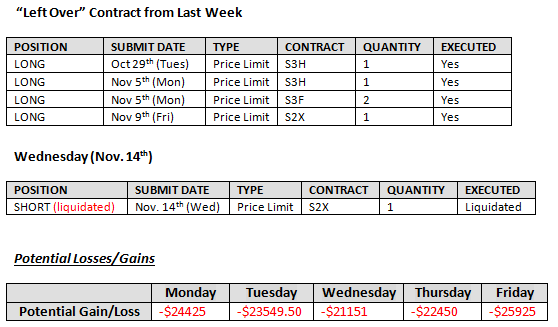
This is probably the first time since the beginning of this trading game that I didn’t make any new transactions. After last Friday (Nov 9th)’s major stumble, soybean futures prices further tumbled on Monday (Nov. 12th) by another 3%, and reached its 5 months low. This was largely due to USDA’s estimation for a bigger U.S. soybean crop. Soybean future prices were pressured by speculators selling future contracts to offset their previously LONG contracts. As a result of the hasty price drop, I received a margin call on all 5 soybean LONG contract, and had a potential loss of -$5950.00 – $5400.00 – $5400-$5000-$2675 = -$24425 on Monday (Nov. 12th). This caught me completely off guard; while knowing that the chance of the soybean prices to rebound to above $1500.00 was less than 0.10%, I did not want to offset the contracts right away. I decided to wait for the soybean prices to rebound, to minimize my loss as much as possible. Fortunately, soybean future prices did increase slightly on Tuesday (Nov. 13th), and Wednesday (Nov.14th) as expected. However, the price spike was so insignificant compared to the drastic price drop. The November 2012 Soybean contract liquidated on Wednesday (Nov. 14th), and led to a loss of 5000 bushels*($1427.00 – $1464.50) = -$1876.00. Soybean future prices further weakened on Thursday (Nov.15th) and Friday (Nov.16th) as a result of the increase in global supply due to South American crops’ positive outlooks, as well as China’s cancellation on previous orders for U.S. soybeans.

To conclude this peaceful-in-terms-of-making-transactions, but dramatic-in-terms-of-losses week, I was traumatized at the beginning of the week, and for the following few days, I simply did not want to accept the losses by refusing to offset the remaining of the LONG soybean contracts. For as long as the contracts were not offset, my losses remained “potential”. This denial of false judgment in soybean futures prices, which led to a major loss, also meant that I couldn’t move on from this soybean failure, and bid on a new contract. This insight hit me on Friday (Nov.16th) morning, after seeing the soybean prices further dropped again. At the realization of this, I have decided to offset all 4 LONG soybean contract early next week, and have a fresh, new start on the trading game.

End of Week 10 Balance:$20017.88


Reference

http://www.agriculture.com/markets/analysis/soybeans/soybes-slip-on-wear-ccelled-ders_10-ar27583

http://www.albertafarmexpress.ca/news/u-s-soybeans-dip-on-renewed-supply-pressure/1001859813/

http://online.wsj.com/article/SB10001424127887324439804578114913699779162.html


Categories
TRADING GAME Uncategorized

WEEK 10 (Part 2): The Road Ahead

Wheat

Wheat futures prices pressured consecutively this past week, as a result of USDA’s updated crop stocks report. On the other note, despite the perfect conditions for good harvest, Ukraine news recently reported that Ukraine may temporarily limit wheat export at the end of November. Wheat exporting from Russia is also slowing, as high domestic prices are making exporting less profitable. Furthermore, Russian prime minister said that they need more time to determine forecasts. He explained that the current harvest forecast is unclear, and that they need another two weeks or three to see whether or not they can expect good winter crops, and decide if they are going to expend their wheat sales.

In general, I predict the wheat future prices to increase slightly, but remain moderately low in the coming week.

Corn

Corn future prices remained low during the week, but spiked on Friday (Nov.16th) due to the U.S. Environmental Protection Agency (EPA) declined the request to relax its requirement on corn ethanol use in gasoline. Officials said that although it’s recognized that earlier drought has made the current situation difficult, particularly for livestock producers, analysis shows that the requirements for a waiver have not been met, and a suspension is unlikely to have an impact on corn, food or fuel prices. This rejection results in a steep decline in the U.S.’ corn production, and corn future prices are likely to remain high for the next while. On the other hand, China, the world’s largest corn consumer, is expecting to harvest 201 million tons of corn this year, which is 4.1% higher compared to last year. This could mean a decrease in importing demand from China.

Looking at the analytical chart pattern, corn future prices are highly likely to drop to offset the rapid price spike from Friday (Nov 16th). However, I doubt that the prices are going to drop to as low as $712.00 as I anticipate the corn future prices to stay relatives high for the upcoming week.

Soybean

Soybean future prices spiked briefly for 2 days last week, but prices further dropped for the most part. Soybean future prices are currently at 5 months low, largely due to China’s cancelled orders on the U.S. soybean, and South American crops’ positive outlooks. China is the world’s largest soybean consumer and importer, and the nation has recently cancelled approximately 600,000 tons of U.S. soybean orders as a result of low domestic demand and recent price drop, which had made the soybeans unprofitable.

Looking at the trend from technical analysis’ aspect, there appears to be a flag pattern that started on Thursday (Nov.15th), and ended on Friday (Nov. 16th). Flags usually result in an upward price trend that spikes above the upper trend line, which means an increase in soybean prices. However, if I identified it correctly, the last candlestick shows a hanging man, which signals an increase in selling pressure. To further justify this, the price briefly spiked in between the flag and hanging man patterns, as shown on the graph above. This could be the result of the flag pattern, which caused the prices to increase. If this was true, soybean future prices are likely to decrease at the opening of the market on Monday (Nov. 19th).

Overall, I anticipate soybean future prices to fluctuate throughout next week. Future prices are likely to stay low, and given the available global soybean supplies, and the futures price patterns, I do not foresee a sharp increase in soybean future prices.


Reference

http://www.agriculture.com/markets/analysis/soybeans/soybes-slip-on-wear-ccelled-ders_10-ar27583

http://www.businessweek.com/news/2012-11-14/soybeans-advance-on-rising-demand-from-china-and-u-dot-s-dot-crushers

http://www.brecorder.com/agriculture-a-allied/183/1259144/

http://www.ft.com/cms/s/0/55626020-3009-11e2-a040-00144feabdc0.html?ftcamp=published_links%2Frss%2Fmarkets%2Ffeed%2F%2Fproduct#axzz2CSMZMG1b

http://futures.tradingcharts.com/intraday/ZS/13

http://www.investopedia.com/university/technical/techanalysis8.asp#axzz2CRtOz7W0

http://www.mysinchew.com/node/79886?tid=37

http://stockcharts.com/school/doku.php?id=chart_school:chart_analysis:introduction_to_candlesticks

http://uk.reuters.com/article/2012/11/16/markets-commodities-idUKL1E8MGCUR20121116


Categories
TRADING GAME Uncategorized

WEEK 10 (Part 3): Cool Source of Information

Website: http://www.investopedia.com/ (Technical Analysis)

I have been depending heavily on Investopedia for information, and resource on technical analysis for the past 2 weeks. As a technical analysis amateur, I browsed through a number of different websites that give “introduction lessons on technical analysis”, and I found Investopedia to be the most user-friendly website.  While not the entire website is designed to teach technical analysis, they do have a section that’s dedicated to it. According to the table of content that’s given, the section on technical analysis is divided into 12 different sections: Introduction, The Basic Assumption, Fundamental Vs. Technical Analysis, The Use of Trend, Support and Resistance, The Importance of Volume, What is a Chart?, Chart Types, Chart Patterns, Moving Averages, Indicators and Oscillators, and Conclusion. Compared to other “technical analysis 101“ websites, Investopedia provides clear labeled diagrams, along with the corresponding definitions, as well as the relevant explanations on the specific pattern or chart that’s being discussed. Further elaboration and examples on each of the patterns and charts examined are also provided. For example, specific examples are often given on how to identify the specific pattern when the price pattern is slightly altered.

Out of all 12 different “lessons” that Investopedia has, personally, I find the Chart Patterns section to be the most useful section, and below is the url to this section:

Technical Analysis: Chart Patterns: http://www.investopedia.com/university/technical/techanalysis8.asp#axzz2Bndk8H5K

Other sections of the investopedia website are not directly relevant to FRE501’s trading game, however, they do provide interesting information on financial information, both in terms of academia and everyday knowledge. In general, Investopedia is a very resourceful website for all economic and financial students, as it allows them to decipher between the various technical analysis patterns and charts.

Categories
TRADING GAME Uncategorized

WEEK 9 (Part 1): The Went Right/Wrong

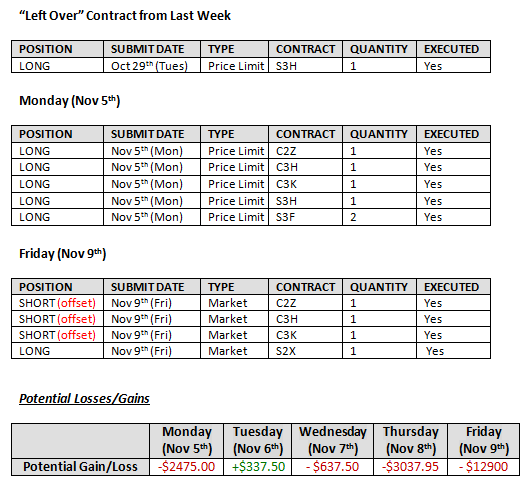
After seeing the drastic decrease in price at the end of last week, and the analytical charts for corn and soybean, I was certain that the future commodity prices for both would increase this week. Therefore, I went long on 3 soybean contracts, and 3 corn contracts. Along with the March 2013 soybean contract (S3H) that I had left from last week, I had a total of 7 soybean and corn contracts going LONG in the market on Monday (Nov 5th) morning.

Unfortunately, my prediction for soybean was totally off this week, and as I was so confident about my prediction on soybean future prices increasing, I decided to wait until soybean prices increase back up again before offsetting the LONG contracts. I thought that even if soybean future prices kept on dropping, they would eventually spike up after they hit limit down. However, soybean prices never rebounded, and the prices dropped hastily for almost the whole week. Even when they did spike slightly on Tuesday (Nov 6th), the increase was not substantial enough to go above my “price ins” by much. Also, I failed to recognize this spike on Tuesday (Nov. 6th) morning; and since I never anticipated such a drastic price drop on Wednesday, Thursday and, especially not Friday, I didn’t even think of offsetting the soybean contracts at the time. Furthermore, I was expecting Wednesday (Nov. 7th)’s U.S. election to dramatically affect the commodity prices. My prophecy was that all commodity prices should increase if Obama won, and the reverse would occur if Romney was elected. However, it clearly didn’t happen, as Obama did end up winning the election, but soybean future prices continued to drop on Thursday (Nov.8th).

January 2013 Soybean Contract (as of Thursday, Nov. 8th, 2012)

March 2013 Soybean Contract (as of Thursday, Nov. 8th, 2012)

I was traumatized when I saw soybean future prices drop by another 20 cents on Friday morning. Instead of rushing to offset all 4 LONG soybean contracts, however, I decided to offset all the LONG corn contracts, which I ended up gaining a small amount from($699.00 + $74.00 + $686.50 = $1459.50), while the prices were still increasing. I also decided to go LONG on one more soybean contract (S2X), because my stubborn self still believed that soybean future prices would increase at anytime, after dropping so hastily and utterly for the whole week.  Also, soybean future prices dropped so low, that I was almost certain that the system would just liquidate all the LONG soybean contracts by the end of Friday (Nov. 9th). Hence, despite the major loss I was incurring from pressured soybean future prices, I offset 3 LONG corn contracts, and left 5 LONG soybean contracts in the market on Friday (Nov.9th) morning.

When I checked the commodity prices again on Friday (Nov.9th) afternoon after the market closed, I was literally staggered at the numbers that I saw – soybean future prices fell by another 47 cents. Surprisingly though, none of the soybeans contracts were liquidated, and most of them had a margin call. My potential loss on soybean from Friday (Nov. 9th) came to a total of – $3525.00 – $3087.50 – $3087.50 – $2575.00 -$625.00 = -$12900

The sharp fall of soybean future prices could be explained by USDA’s crop forecast, which was released on Friday (Nov 9th). Soybean future prices declined immediately after USDA predicted that soybean production would be 2.97 billion bushels, which was 4% higher than October’s estimation. Wheat and corn future prices also fell, but the decline in price was not nearly as dramatic compared to that of soybean. As for my contracts that are currently losing in the market, I am going to keep the LONG soybean contracts until soybean future prices rebounds again next week. I highly doubt the prices are going to spike up to above $1500/bushel again, my strategy is to reduce as much loss as possible on the 5 LONG soybean contracts.

January 2013 Soybean Contract (as of Friday, Nov. 9th, 2012)

End of Week 9 Balance: $34918.29


Reference

http://futures.tradingcharts.com/intraday/ZSX2?anticache=1351922666

http://futures.tradingcharts.com/intraday/ZSF3?anticache=1352436983

http://futures.tradingcharts.com/intraday/ZSH3?anticache=1352436985

http://www.businessweek.com/ap/2012-11-09/soybean-prices-fall-sharply-on-crop-forecast


Categories
TRADING GAME Uncategorized

WEEK 9 (Part 2): The Road Ahead (Technical Analysis)

Wheat

Even though the drop was not as drastic as soybean’s, wheat future prices also dropped after the release of the USDA crop report on Friday (Nov. 9th).

If I identified it correctly, the candle stick diagram shows a hammer, which indicates a potential trend reversal that is present at the end of the chart. December 2012 wheat price is likely to spike early next week. However, from the area graph, I spotted an oblivious head and shoulder pattern, which is currently unfinished. It appears to be in the middle of forming the second shoulder, and if this is true, wheat future prices is unlikely to rebound pass the “head” spike, which means that wheat future prices spike is not going to go above $900.00 / bushel next week.

December 2012 Wheat Contract (Candle Stick)

December 2012 Wheat Contract (Area)

Corn

Corn future prices have stayed relatively stable compared to other commodity future prices, but prices did drop slightly at the release of the USDA crop report. I found recent corn future prices rather hard to predict, because there have been a lot of small price fluctuations occurring. From the candle stick chart, I believe that there are blending candles forming at the end Friday (Nov.9th), since the last one (red) is much longer than the previous green candle. I predict that the next candle is going to be a hammer, and future prices are going to continue decreasing slightly, and rebound.

December 2012 Corn Contract (1 week Period)

Looking at the 2 months period analytical chart for corn, I spot the formation of a descending triangle, which is a signal for selling. The descending triangle means there has been a downtrend prior to the triangle, and future prices are anticipated to drop. Therefore, I anticipate corn prices to decrease within the next couple of months. Since the candle chart used is for December 2012 corn contract, which is going to deliver before 2013, corn price can be expected to drop further before the expiry day.

December 2012 Corn Contract (2 Month Period)

Soybean

Soybean future prices plunged on Friday (Nov.9th) due to the release of the USDA crop report; future prices dropped by over 40 cents within just a few hours. The contract that expires in November 2012 fell 47.25%, the lowest since June 22, 2012. By observing the trading charts for November 2012, and January 2013 contracts, if I spotted them correctly, I see hammer at the end of the graphs for both contracts. Hammers are reversal patterns that usually form after a decline. Hammers also mark support, or “limit down” levels. Since there are hammers for both November 2012 contract, and January 2012 contract, I predict there to be a price rebound for soybean at the beginning of next week, right after the market opens. Thus, I’m going to keep all 5 LONG soybean contracts in the market, until soybean future prices spikes, to minimize my loss from Friday (Nov.9th)’s sharp drop in soybean prices.

November 2012 Soybean Contract

January 2013 Soybean Contract

Looking slightly further into the future, assuming I identified the head and shoulders patterns properly, I foresee a decrease in soybean prices for the next couple of months. As indicated in the charts below (see labels), there appears to be a head and shoulders pattern in both November 2012, and January 2013 soybean contracts. Also, neither of these head and shoulder patterns are inversed, indicating that the prices should decline for the next few months.

January 2013 Soybean Contract

November 2012 Soybean Contract


Reference

http://www.barchart.com/chart.php?sym=ZCZ12&style=technical&template=&p=DO&d=L&sd=&ed=&size=M&log=0&t=CANDLE&v=2&g=1&evnt=1&late=1&o1=&o2=&o3=&sh=100&indicators=&addindicator=&submitted=1&fpage=&txtDate

http://www.barchart.com/chart.php?sym=ZSX12&t=AREA&size=M&v=2&g=1&p=D&d=X&qb=1&style=technical&template

http://www.barchart.com/chart.php?sym=ZSF13&style=technical&template=&p=DO&d=M&sd=&ed=&size=M&log=0&t=AREA&v=2&g=1&evnt=1&late=1&o1=&o2=&o3=&sh=100&indicators=&addindicator=&submitted=1&fpage=&txtDate

http://www.barchart.com/chart.php?sym=ZWZ12&t=AREA&size=M&v=2&g=1&p=I:30&d=X&qb=1&style=technical&template

http://futures.tradingcharts.com/intraday/ZCZ2?anticache=1352568978

http://futures.tradingcharts.com/intraday/ZSF3?anticache=1352535382

http://futures.tradingcharts.com/intraday/ZSX2?anticache=1352536711

http://futures.tradingcharts.com/intraday/ZWZ2?anticache=1352567597

http://www.investopedia.com/university/technical/techanalysis8.asp#axzz2Bndk8H5K

http://online.wsj.com/article/SB10001424127887324894104578108870189617926.html

http://stockcharts.com/school/doku.php?id=chart_school:chart_analysis:introduction_to_candlesticks


Categories
TRADING GAME Uncategorized

WEEK 9 (Part 3): Cool Source of Information

Website 1: http://www.topnews.in/business-news/commodity-update

One of the websites that I recently started visiting more frequently is TopNews.in. This website is very organized and strictly divided into different segments. For instance, Under Analyst View, they divided the sector into TopNews UAE, Top News, New Zealand, Company News, Singapore, Asia Edition, United States and Spain. It’s mostly organized by region, as well as by the level of importance. For the FRE 501 trading game, United   States would be the most relevant one. While the downside about this website is similar to that of Trading Floor – not everything are future commodity trading related, however, they do have a sector specifically dedicated to Commodity Updates (see link above). I find their news rather differentiated from the other commodity news that I usually get from Google News. Some of the articles they provided are written from a diverse perspective, and allows readers to view things from a different aspect. Furthermore, several of the articles provided on the website contain commodity trading tips and personal opinions from experts, hence it is not entirely news oriented. Personally I really liked this website for this, because it’s always harder to research for “opinions” than “news that has already happened”. Even though these experts aren’t responsible for our gains and losses from trading, and most of the time their opinions are biased to some extent, I still find reading professional’s opinions and tips more enjoyable and valuable than simply reading news report. This is also why I recommend this website to my fellow classmates this week: it contains a combination of news and personal tips from experts; readers get the best of both worlds!

Website 2: http://www.barchart.com/

I’ve also started using Barchart since Wednesday (Nov.7th)’s tutorial on technical analysis. While Trading Chart is still the go-to website for me when it comes to basic analytical charts, Barcharts provides better trading charts with more options. For instance, I find it much easier to analyze the trading charts with the price patterns colored (area), but Trading Chart doesn’t have that option, whereas Barcharts does. Therefore, to analyze the price patterns in more depth, Barchart is a more optimal website to get daily trading charts than Trading Chart.


Categories
TRADING GAME Uncategorized

WEEK 8 (Part 1): The Went Right/Wrong

WHAT WENT RIGHT? As mentioned in last week’s blog, I anticipated that all 3 commodities future prices to increase this week. On Monday (Oct.29th) morning, I set up 1 price limit order for December wheat, as well as 4 different price limit contracts for January and March 2013 soybeans, because of the rumor on China increasing import demand for soybean, which could potentially increase the future prices dramatically. Fortunately, all the contracts were triggered sometimes during the day. I also managed to offset my short wheat contract from last week. Though there was some increase in price, futures prices for soybean didn’t show any signs of substantial increase until Tuesday (Oct 30th). Both wheat and soybean prices spiked on Wednesday (Oct 31st); I wasn’t sure how long they were going to increase for, and since I did have a large number of LONG contracts on hand, I tried to offset 1 soybean contract, and 1 wheat contract. The wheat contract was offset when wheat prices nearly reached its daily peaking price, and I earned $1061.50. The January 2012 soybean (S3F) contract failed to offset, because the price limit I set was never reached, which turned out to be a good thing as the soybean future prices further spiked on Thursday, which was totally unforeseen. According to Reuters Africa, China, world’s biggest soybean importer, was still the key cause to the boosting of soybean prices this week. Reuters Africa explained that October’s economic data from China revived and that there were signs of them increasing the imports for soybean. In addition, China’s annual harvest has decreased in a few key planting provinces. In addition, there was concern regarding South American’s soy crops being less than estimated, due to delayed planting caused by wet weather.

After seeing the price spiked yet again on Thursday (Nov 1st) morning, I knew I wanted to offset all 4 soybean contracts, since the chance of them continuing to increase for an extra day was very slim. I sent in 4 price limit orders on Thursday (Nov 1st) morning, and hoped that all of them would be offset successfully. While 3 of them did offset, one of the March 2013 soybean contract didn’t. From the 3 LONG soybean contracts that did offset, I managed to earn $1399.00 + $1674.00 + $1325.00 = $4398.00. I made an attempt to offset the LONG soybean contract again on Friday (Nov 2nd) morning, along with another January 2013 Soybean contract going SHORT. Unfortunately, neither of the orders went through, and as of Friday, I have a potential loss of $162.50 on the March 2013 Soybean contract.

WHAT WENT WRONG? I really should’ve set a lower price limit for the LONG March 2013 Soybean contract (S3H), so that it could offset on Thursday (Nov 1st). Also, instead of trying to get into the market on Friday (Nov 2nd)morning (and failed), I should have sent in a few soybean contracts going SHORT before the market closed on Thursday (Nov 1st); since it was obvious that soybean future prices could start dropping at any minute, after dramatically increasing for 3 days straight.

WHAT NOW? With the soybean future prices utterly decreasing, I still have a March 2013 Soybean contract in the market going LONG. From looking at the natural disasters that’s occurring all over the world, and the deleterious weather farmers face when planting, I anticipate that soybean future prices to increase in the long run. Hence, I’m going to be optimistic and keep the LONG S3H contract in the market until the soybean prices bounce up again.

End of Week 8 Balance: $46198.07


Reference

http://af.reuters.com/article/commoditiesNews/idAFL3E8M14XM20121101

http://futures.tradingcharts.com/intraday/ZSX2?anticache=1351825200


Categories
TRADING GAME Uncategorized

WEEK 8 (Part 2): The Road Ahead

Meteorologists and agronomists in the U.S.warn that the threat of the drought has not yet passed. Also, dry weather in the western U.S. is starting to severely damage the crops’ winter planting and production. Important agricultural states, such as Nebraska and Kansas have the lowest level of moisture in years. Climate experts estimate that certain areas need additionally 5 to 6 feet of snow to over 15 inches of precipitations over the next months in order for crops to revert to their normal conditions. In general, I anticipate commodity future prices to increase in the coming future, as a result of the recent disastrous weather that’s damaging the crops, along with the natural disasters that’s occurring around the world.

On the other hand, USDA was scheduled to release updated crop estimations on November 9th (Friday), which is likely to affect the commodity futures prices.

Wheat

While heavy rains hit the eastern U.S. last week when Hurricane Sandy roared, the west region remained waterless. Dry weather still remains to be a problem in the U.S. Plains winter wheat belt. Joel Widenor, a meteorologist for Commodity Weather Group, claimed that a continued lack of rain in the Plains area is likely to cause a third of the wheat crops entering winter poorly established. These areas will be vulnerable to the cold air that’s approaching. Normally, the new winter wheat crop should already be established with steady roots for the cold winter, but the wheat has only started emerging this year. Currently 15% of the U.S.winter wheat crops are rated to be very poor, 45% fair, and only 40% are ranked good to excellent. Hence, I expect wheat commodity prices to increase as winter approaches.

Looking from the technical aspect though, it appears that recent wheat futures prices have been fluctuating quite rapidly. Personally, I’m quite unlikely to be buying or selling any wheat contracts next week, as I find recent wheat market patterns quite difficult to predict, especially since I prefer offsetting all of the contracts before the end of the week if feasible. However, I might consider going LONG on one of the wheat contract that expires in 2013, and leave it in the market for a few weeks, to wait for the future prices to increase.

Corn

Analysts are suspecting some producers could switch corn acres to soybeans, as there’s concern about delayed corn planting in South America. If this happens, South America could lose to about 20% of corn production for 2012/2013 due to excessive precipitations, and flooding. Furthermore, Brazil’s trade ministry said that the country has exported a record of 3.66 million metric tons in October. The drought in the U.S. has increased the global demand for corn, and Brazil is expected to export a total of 17 million metric tons of soybean. Brazil is also exporting increasing amount of ethanol, as it is the main feedstock for ethanol in North America. However, as its stocks decreases, exporting business is gradually shifting back to the U.S., which causes the corn price to increase. On the other hand, Hurricane Sandy has improved the weather condition in the eastern Midwest region of the U.S., which is expected to aid the harvest of the final U.S. corns and soybeans. To conclude, planting concerns in the South America, and shifting of exporting market could both increase corn future prices, while improved weather condition is likely to decrease corn prices.

While news is once again pulling corn future prices both ways, from the analytical chart above, I think corn prices are highly likely to increase at the beginning of next week, unless breaking news happens over the weekend.  Otherwise, I am going to go LONG in a few corn contracts at the beginning of week 9.

Soybean

Soybean futures prices were pressured, and dropped by over 30 cents on Friday. It was largely due to recent private firms’ optimistic estimations on theU.S.’ 2012 soybean and corn harvest, which were above USDA’s estimation. USDA’s October estimation for the U.S. soybean crop was 2.860 billion bushels, while INTL FCStone estimated the soybean crop to be at 2.959 billion bushels on Thursday, and Informa Economics estimated the soybean crop to be 2.925 billion bushels on Friday. USDA also mentioned that the US soybean harvest was 87% complete already. In addition, the dry weather in the western U.S. is affecting soybean planting, as well as other crops.

On the contrary, the growing concern regarding South America’s planting delay hasn’t been diminished, and it could cause producers to switch from corn acres to soybeans, which means there could be an increase in soybean production in 2012/2013. If it does occur, it could potentially decrease soybean futures prices. Also, improved weather in the eastern Midwest part of the U.S. should assist the harvesting of the final U.S. corn and soybeans for the ten days.

Soybean price dropped by more than 30 cents after CBOT closed on Friday (Nov 2nd). As shown above, the hastily fall in soybean commodity price allowed soybean prices to return to the price level they were at before they spiked three days ago (as shown above). If no breaking news occurs over the weekend, I foresee soybean future prices to drop to a stop early next week, perhaps stabilizes for a day or so, and rebound up latter during the week. Also, I doubt next week’s price fluctuations in soybean are going to be as thrilling as they were this week, especially since recent news are pulling the commodity prices both ways.

Reference

http://af.reuters.com/article/commoditiesNews/idAFL3E8M261J20121102

http://www.brecorder.com/markets/commodities/america/88605-cbot-corn-down-on-technical-selling-.html

http://www.brecorder.com/agriculture-a-allied/183/1253793/

http://futures.tradingcharts.com/intraday/ZSX2?anticache=1351922666

http://mobile.reuters.com/article/idUSBRE8A112T20121102?irpc=932

http://www.reuters.com/article/2012/11/01/us-brazil-commodities-exports-idUSBRE8A01DO20121101
 

Categories
TRADING GAME Uncategorized

WEEK 8 (Part 3): Cool Source of Information

Website: http://www.tradingfloor.com/

Trading Floor is a very professional and formal website consists of a wide range of information from popular financial blogs, to trading mentor videos. It is an online community, targeting people who trade futures, stocks, FX options, CFDs, and Trade Forex. Trading Floor is connected with some of the experienced traders from different fields, such as equity strategists, macroeconomics pros, and most certainly, commodity trading strategists. These featured experts give advises and personal opinions for readers by commenting on the website on a regular basis. Similar to Twitter, this website allows people to follow these experts to receive updates from them. Here is the link to the list of trading experts that Trading Floor features: http://www.tradingfloor.com/traders

As mentioned earlier, Trading Floor is designed for not only future commodities traders, but also traders from other markets as well. For this reason, certain information provided on the website is not relevant to FRE501’s trading game. However, since they have everything divided into different sections, we can simply go to the agriculture section under topics, and it provides updated information on soybeans and corns. For example, one of the recent updates on agricultural commodity was by Ole Hansen, Head of Commodity Strategy at Saxo Bank; he discussed the recent grain ratio updates, with corresponding graphs. He mentioned that both soybean/corn ratio and corn/wheat ratio are very stable, except that wheat tends to do slightly better due to weather problems in exporting countries, and soybeans are likely to underperform due to the recent news on South American crop. Both of which corresponded to what has happened with the commodity markets in the past week. Therefore, even though not all the information provided is necessarily directly aimed at future commodity traders, crops are crops, what happens to the world crop production, and demands and supplies of importers and exporters of these commodities should affect all the markets equally.  Thus, I find Trading Floor useful despite the additional information it contains on other markets.

(Source: http://www.tradingfloor.com/topics/soya-beans)


Categories
TRADING GAME Uncategorized

WEEK 7 (Part 1): The Went Right/Wrong

WEEK 6 RECAP

I finally managed to take advantage of the wheat prices fluctuation, and offset both contracts with a slight gain after keeping them in the market for 3 weeks. The short contract (W2Z) was offset first at the beginning of the week, while the price was low, and I set a price limit on the long contract (W3H), which was triggered after wheat price rebounded.

End of Week 6 Balance: $40668.59

***

WEEK 7

HOW I MEANT TO PLAY THE GAME… Both corn and wheat futures prices spiked for two days straight at the end of week 6; I was certain that commodity future prices would drop for the first half of the week, and rebound during the latter half. Given my prediction for the next few days, my initial plan was to go SHORT on several wheat and corn contracts early on Monday (Oct 22nd) morning, and offset them before the market closes on Tuesday (Oct.23rd). Perhaps, wait for a day, to re-enter the market with a few LONG contracts for both commodities, given that corn and wheat would rebound after the drop from Monday, and Tuesday. I would then offset all of my long contracts before the market closes on Friday, and keep no contracts in the market over the weekend.

WHAT REALLY HAPPENED? Tradesim didn’t allow my week to go as planned. I set up a few price limit orders for 3 SHORT wheat contracts, and 1 SHORT corn contract on Monday morning. Based on the price record from CME, it was clear that both wheat and corn future prices went above the price limits that I’ve set on Monday. However, Tradesim failed to trigger my price limit orders, and none of the contracts were executed. I became frustrated after I saw the prices for both commodities started to show signs of dropping on Monday night, and resent my orders with market orders. While they did get processed the next day, Tradesim lagged, and my orders weren’t processed until right before the market closed on Tuesday. By then, the prices have already hit their limit down, and started to rebound. As a result, even though corn and wheat commodity prices were dropping for the entire Tuesday, my total gain was negative due to my low “price in” prices. I essentially went SHORT after the future prices were finished descending. Knowing that I wasn’t going to make any gains with both commodities’ price patterns going upward; I sent in another 4 price limit orders, and set the prices just below my “price-ins”, to allow the contracts to automatically offset themselves once the commodity prices decrease again.

HOW THE WEEK ENDED… After Ukraine had confirmed a ban on exports of wheat on Wednesday, both corn and wheat future prices spiked. I was potentially losing a total of $2962.00, and 3 of the contracts were receiving margin calls. None of the price limit orders were triggered, because the prices went the opposite direction. Fortunately, spiked prices were responded by a drop on Thursday; corn price dropped low enough that the price limit order managed to offset the contract, and I earned $174.00. My potential loss for the 3 SHORT wheat contracts has also decreased to $1312.00, and the margin calls were cancelled. Commodity futures prices continued to drop on Friday, and the price limit for 2 of the SHORT wheat contracts were triggered. I managed to earn $61.50 for each contract, which total up to be 2*$61.50 = $123.00. As of Friday, my potential loss for W3H SHORT contract is $200.00.

End of Week 6 Balance: $40765.34


It appears that Tradesim has been having difficulty processing my orders at the time that I intended them to, and I always ended up entering the market after the predicted prices have completed fluctuating.  As a result, the prices usually have already started to move in the opposite direction by the time my contracts are in. I wonder if it would be better to just do the opposite of where I think the prices are going to go, and take the lagging period into consideration when making trading decisions.


Spam prevention powered by Akismet