European Versus Emerging Markets

Speaking of investments in financial assets, is it the right time to disinvest from emerging economies and return to the European equity? On the outset, we have seen recovery in Pan-Euro countries, ie: Paris in France, and San Paolo in Italy. Investors are gaining confidence in market as ibanks such as Goldman Sachs rises exposure to the E.U. equities.

Prior to purchasing any Euro equity, we should assess the following risk factors:

1) Political instability

2) Fluctuations in investment costs

3) market sentiment & any events affecting currency’s performance

There is no hardline answer as to what strategy/position we should take on. As fixed income bond demand is increasing, we see lower margins from emerging market  assets. Investors are more attracted to European equities. I will mention briefly the market trend and provide insights as I see appropriate to the situation.

The rationale behind shifting away from emerging markets to Euro is as follows:

Since emerging markets are moving in tendum with developed markets, it is best to hedge our risks if we insist on maintaining equity holdings in China/India. In my opinion, it is best to reallocate investments to assets with less correlation and co-movement tendencies with the United States’ political and military actions. Thus, I recommend to stay away from oil & mineral commodities subject to political tensions and uncertainties between Middle East and North America.

However, this positive momentum doesn’t come so easily across sectors. For the auto-industry, they have reached the trough with drastic sales decrease and meagre/negative profits due to overcapacity. Christien Klingler, the sales chief at VolkesWagen, pointed out the benefit seeps through gradually with slow stabilization effects.

With an increase in exports and regional spending, the E.U. regions are slowly showing signs of revivals. Economists are prudently awaiting for major stimulus and remedial measures to come into effect. At this point in time, we are still keeping a watchful eye on unemployment rates and consumer spending. Currently, unemployment hovers at high rate of 12.1% across the 17 Euro-Bloc countries. Consumer spending remains low on durable and luxury goods. Hence, it is best to stay put and await for full recovery.

On the brighter note, PSA Peugeot Citroen and VolksWagen have indicated upbeat tone on sales; indicating a positive forecast for 2014. Carlos Ghosn, Head of Renault, estimated a 3% growth in global auto market this year. Nissan Motor, on the other hand, provided a more conservative estimate of 1.5%. Overall, we would expect the industry gaining momentum as it reaches “the end of the tunnel next year.”

For the time being, demand for luxury cars remain low within Europe. It would take another year or two for car brands such as VW’s Audi to recapture the Euro-market. Not surprisingly, Asian and North American demand rises for premium car brands from the German manufacturers: VW, BMW and Daimler. This robust growth has enabled auto-industry to thrive despite a downward pressure of car prices in Europe.

 References

Cremer, Andreas & Frost, Laurence. “European Car-makers see long roads to recovery.” Sep 10, 2013. Thomson Reuters.<<http://www.reuters.com/article/2013/09/10/us-autoshow-frankfurt-idUSBRE9890AD20130910>>.

Wheatley, Jonathan. “The Emerging Market Growth Story Dies.” <<http://www.ft.com/cms/s/0/76fde4da-f5d8-11e2-8388-00144feabdc0.html#axzz2eWB8Fim4>>.

Portuguese road toll.. A stunt to economic growth?

Overview of the road toll system

Toll payment is debited in a day or two for each passage. For a Portuguese resident, their payments are based on a small transponder linked to their Portuguese bank account.

Alternatively, tolls could be paid at the Post Office or Pay Shop within five days, but after transpiration in 48 hours. In fact, it is easier for the system to recognize license plates if you rent a car with Portuguese plates. However, the system does not allow post-pay tolls if your number plates are originated from foreign jurisdictions.

So if you are a visitor, how does the transaction process, how much does it cost?

If you are arriving at the Spanish Border with a foreign license plate, you will find an automated vending machine at A22. To execute the transaction, you are required to rent a transponder and pin in your vehicle registration number and credit card. On the return trip, as long as you return your rental transponder at Olhao (the last service station), you would be able to obtain your refundable deposit less the amount of rental fee. All tolls will be charged to your credit card, so make sure your cards are valid and unexpired prior to this trip!! In case the vending machines are busy, you can rent a transponder at the first service area on the motorway (Olhao) or any Post Office, and from the Faro Airport (in the Post Office).

Cost:  €27.50 (refundable less the rental charge); valid for 90 days. First week has a rental cost of  €6, and €1.50 thereafter. Tolls are charged to your credit card.

Two options for a foreign registered car

1) Purchase a pre-paid pass valid for three days from any Post Office. For a normal vehicle, a €20 three-day pass can be used for unlimited tolls along the motorwat for three consecutive days. However, you can only purchase six of these passes every year. For the prepaid airport trip, you can buy a one-way or return trip pre-paid ticket to Faro Airport (via A22). Francisco Sá Carneiro Airport (Porto) (via A28/A41); or Francisco Sá Carneiro Airport (via A41/A42) from any Post Office

2) Purchase a five day pass from any Post Office at €10 or more. You must prepay enough tolls to ensure sufficient deposit to cover your expected journeys.

3) Using the Easy Toll & Toll Card system developed by Estradas de Portugal alongside the UNICRE electronic payment company and the CTT postal service:

Methods of payment: Easy Toll & Toll card

Easy Toll: available at the border crossings into Portugal near the former SCUT motorway; Vila Formoso (A25), Vila Real de Santo António (A22), Chaves (A24) and Vila Nova de Cerveira (EN13).

How it works: Drivers with foreign license plates could associate their number plate to a bank card for a period of up to one month, with toll charges being debited directly from their account up to a period of one month.

Toll Card: Five, ten, 20 or 40 euros prepayments. These “Pay-as-you go” cards is activated and linked to a vehicle licence number via text message. All cards can be bought at post offices, motorway services stations, and online.

You can buy from either of those with normal toll charge based on duration and route(s). Any refunds of unused tolls are said feasible, but such instances are still ‘unheard’ of.. Some people said unused portion of the payment will be refunded to the Credit Card account automatically. ***Once you get your receipt, place it on the dashboard, and keep in a safe place after using.

Policy concerns

Since 1986, Portuguese invested huge share in structural and cohesion funds to modernize infrastructures. On the outset, road infrastructure investment would serve as an essential catalyst to fuel economic growth, by making Portugal a more attractive nation for domestic and FDIs. However, expansion in road supply is insufficient to address the issue of lacking in international competitiveness. In fact, high road tolls compounded by complexity in the payment system can disincentivize multinational corporations to situate their core business activities in the country. Due to inconvenience to obtain authorization for major road access, Portugal can lose popularity from tourists.

The Easy Toll & Toll Card system has improved relative to the conventional policy measures. However, the authority should consider reducing road tolls and reinstate after-exit payment system to stimulate regional economic activities. They should further upgrade the toll system by using automated payment systems and install road sensors to detect individual vehicles. With higher efficiency in road infrastructure access and payment system, per-vehicle road usage wold increase, thereby boosting toll revenues through higher traffic volume. This would serve as a mutually beneficial situation for road users and toll payees with lower incidences of road accidents and better linkage between rural communities and business centres.

References

Walton, Eloise. “The Toll Solution Confusion.” <<http://www.theportugalnews.com/news/toll-solution-confusion/26400>>. The Portugal News Online. July 19, 2012. Sep 9, 2013.


London Congestion Tax Policy

Congestion issues are prevalent across many metropolitan areas in various nations. The Economic cost are captured in terms of monetary value, and reflected in the underlying negative externalities. These costs include: additional commute time, petroleum cost, increase in green house gas emissions, and disutility to commuters. In this blog entry, I will address the issue in the London Congestion Tax Policy.

The London congestion charge was introduced in February 2003. This policy is a taxation scheme specifically targeted within the Congestion Charge Zone (CCZ). It is levied on vehicles during peak hours on business days from 7 am to 6 pm.

Policy Coverage

The regions receiving charges involves the City of London, and the West End. In addition, charges apply to the various major roads: Pentonville Road, City Road, Old Street Commercial Street, and Mansell Street, etc. (Wikipedia.org).

In order to monitor for taxable vehicles, IBM utilizes an automatic number plate recognition technology (ANPR), and the Transport for London (TfL) is responsible for revenue collection.

By convention, there is price discrimination for vehicles paying at different times, and paying method. If vehicles pay by midnight on the day of travel, the charge would be £10 per day (Transport for London). However, if the charge is paid the next day, £12 is applied. Alternatively, vehicles would pay £9 charge, if it is registered with CC Auto-pay (TfL). This payment scheme incentivizes drivers to pay on time, and to use the auto-pay method to increase efficiency. Any failure on payment, would incur £120 charges (politics.co.uk, 2013). This would be reduced to £60 for payment in 14 days. However, there would be surge charges to £187 after 28 days. Auto-payment can be registered via TfL.

Tax exempted vehicles

Vehicle on roadside maintenance, registered cars fulfilling emissions of 100g/km or less of CO2, in addition to the Euro 5 standard, vehicles with nine or more seats, motor-tricycles are exempted from the taxation scheme (tfl.gov.uk, 21). There are refunds available to individuals who pay monthly or annual cash advance, alongside reimbursements to patients who are unable to travel by public transit. The exemption also extends to the firefighters, and the care-takers of patients who are driving vehicles (ibid, p.21). Residents close to or living in the Congestion Charge Zone can apply for a 90% discount via CC Auto-payment method (ibid. p.10). Free road access was also granted to hybrid cars (ibid p.25). However, the reformation of the discount policy on hybrid vehicles introduces a more stringent standard to hybrid, and electric car emissions. This reformation involves changing the original policy of discounts to greener vehicles in general, to a new Ultra Low Emission Discount Scheme. Hence, free access no longer applies to some hybrid vehicles.

Problem with revenue collection

In the Department of Transportation, the annual report mentioned the loss of tax revenue collection from this policy was approximately 26% due to the fact that the registered-vehicle owner was bankrupted, deceased, or untraceable (Wikipedia.org).

In addition, there are problems within the detection system reading foreign license plates (Police Executive Research Forum). By local law, foreign cars can only be used within the duration of six months prior to registering with the UK license plates. This condition applies to both visitors and non-residents (Vehicle Excise and Registration Act, 1994).

In addition, local newspapers reported incidence of duplicates of number plates in order to avoid congestion charges (BBC News, 2004). However, since TfL is a well-developed monitory body with adequate records for the number plates, it is difficult for vehicle owners to avoid congestion taxes.

Implementation Results

For the first six months of implementation, a survey from TfL indicated that the average number of cars in the central zone has been reduced by 60,000, which represents 21 percent decrease (Fahey, Trinity College Dublin). In addition, 50-60% of the reduction was attributed to the use of public transit, 20-30% was attributed with avoidance access to charged zones (Dunt & Stevenson). The remainder was attributed to access outside peak hours, cycling, increased car-sharing, and reduced trips (ibid).

The TfL is the authority responsible for congestion tax collection. In the fiscal year 2009/10, the TfL raised £148m in net revenue, which is then used for investment in improving the transportation system in London (Department of Transportation, 2013).

Hence, the Congestion charge results in displacement of automobiles.

Distributional Effects

Congestion tax is aimed at charging frequent drivers at traffic-sensitive zones.

I would infer that the Government has imposed a progressive tax, which implies as households or individual private income increases, there is a higher “vehicle ownership rates,” and “vehicle utilization rates. (Crawford, 3)”

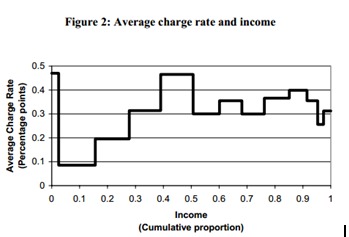
However, the regressivity/progressivity of the tax varies (ibid, 4). According to the Institute of Fiscal Studies, the nature of the tax largely depends on “whether the average level of income in households increases faster or less fast, than the ability to pay as we consider successively higher income bands. Thus, the average charge rate varies in income. (Crawford, 5)” As we examine the changes in average charge rates from lower to middle income bands, average charge rate increases (Crawford, 5). However, the charge rate diminishes as we move to households on the higher level of the distribution. We can infer that the tax is progressive from lower to middle income levels, since average charge rate increases with income. However, the progressivity diminishes in transition from middle income to higher income (ibid). Beyond the point of middle income, average charge rate declines at higher income level (ibid). Thus, the tax becomes regressive. Higher income pays a lower rate of charge.

Source: Crawford, Ian. “The Distributional Effects of the Proposed London Charging Scheme.” Institution of Fiscal Studies <<http://www.ifs.org.uk/bns/bn11.pdf>>.

In general, the Congestion Tax policy is effective. This is because the revenue is recycled towards road infrastructure development, which mitigates the tax burden in lower income households (Crawford, 6).

Evaluation of efficiency & Recommendations

If the tax is effective, we would anticipate a reduction in road access. However, we are uncertain about the elasticity of road demand. A higher elasticity would result in larger reduction in demand, and the converse is true.

Vehicles from the commercial and public sector tend to be inelastic in terms of access to certain routes. In terms of vehicle size, it is not uncommon to have tractors, trucks, large SUVs on the road in these two sectors. Henceforth, when we examine the fuel economy associated with larger vehicles, a higher usage in petroleum results in greener house gas emissions.

On the other hand, vehicles of personal use, depending on the size of the household, and consumer preference on vehicle size, vehicle size varies from large movable dwellings, SUVs, vans to lighter private cars like mini cooper, and hybrids.

In my opinion, the daily access fee could be more effective if it is levied at different rates based on fuel economy, in addition to vehicle size. Given that the government has sufficient funding to invest on road infrastructure, Boris Johnson, the Mayor, should propose an investment project on weigh in motion systems (WIS) to levy on vehicles with higher mass. As a result, this new technology could enhance, not only efficiency in traffic flow, but also target specifically on vehicles with higher green house gas emissions.

In the near future, vehicles could have RFID tags to identify vehicles’ modelling year, which allows the TfL to compare the charged vehicle against a fuel economy database to determine the trip’s environmental impact.

Works Cited

BBC News. “Car Cloners Trying to Avoid Charges.” 24 June, 2004. 19 March, 2013. <<http://news.bbc.co.uk/2/hi/uk_news/england/devon/3837349.stm>>.

Crawford, Ian. “The distributional effects of the proposed London congestion charge scheme.” 20 March, 2013. <<http://www.ifs.org.uk/bns/bn11.pdf>>.

Dunt, Ian and Stevenson, Alex. “Congestion Charge.” 20 March, 2013. <<http://www.politics.co.uk/reference/congestion-charge>>.

Fahey, Colm. “Analysis of Road Pricing and a study of the  feasibility on the M50.” 20 March, 2013. <<www.tcd.ie/Economics/SER/sql/download.php?key=86>>.

Her Majesty’s Stationery Office. “Vehicle Excise and Registration Act.” 18 March, 2013.<<http://www.legislation.gov.uk/ukpga/1994/22/contents>>.

“London Congestion Charge Consequences.” 18 March, 2013.<<http://www.cchargelondon.com/effect.html>>.

Multiple Contributors. “London Congestion Charge.” 18 March, 2013. <<http://en.wikipedia.org/wiki/London_congestion_charge>>.

Police Executive Research Forum. January 2012. “How are innovative technologies transforming policing.”  18 March, 2013. <<http://policeforum.org/library/critical-issues-in-policing-series/Technology_web2.pdf>>.

Transportation For London. “Discount for exemptions, transport for London.” 16 March. 2013.  <<http://www.tfl.gov.uk/roadusers/congestioncharging/6713.aspx>>

Transportation for London. “What do you need to know about congestion tax charging.” March 15, 2013. <<http://www.tfl.gov.uk/assets/downloads/congestion-charging.pdf>>.

Landfill taxation policy in the Netherlands

Motivation

As I’ve browsed through the economic blogs online, landfill tax policy analysis is not quite as a conspicuously popular topic of interest as I perceived. I will give you an overview of the tax instrument adopted on landfill waste. My starting point for landfill policy analysis would address the following concerns: Does the tax policy achieve revenue neutrality? Does it have appropriate tax rate charged to the polluters? In other words, does the tax rate achieve optimality by equating private benefits of damage to social marginal cost? If not, what are the possible alternatives or recommendations to enhance the tax policy in the Netherlands?

Brief Overview Of the Landfill Tax History

The European Commission plays a pivotal role in the development of a thematic strategy on waste recycling and curtailment. One of the economic instruments is landfill taxes.

The Netherlands introduced the landfill tax in 1995. The motivation behind implementing this policy was primarily driven by decision-makers’ political and administrative interests. They wanted to bridge the gap between the costs of landfilling and incineration.

In 2002, the decision was made to centralize responsibility within waste management by shifting the powers from the provincial authorities to the central government authorities. The amendment to the Environmental Management Act reflecting the change came into force on 8 May 2002.

Landfill Tax System – How does it work?

Netherlands created the landfill tax in 1995.The landfill of municipal waste and recyclable waste is banned, as well as separated construction and demolition waste. However, the Ministry of Finance has decided to abolish the tax policy in order to simplify the tax system. In recent years, revenues from the tax on landfill have drastically decreased in line with the reduction of the waste landfilled. Consequently, the tax has been eliminated on 1 January 2012.

Initially when the tax was introduced, the rate was levied at EUR 13 per tonne. In 2000, two different levels of taxes were introduced. The policy aimed at charging landfilled waste high taxes for a diversion towards incineration if recycling is not a feasible option. This high tax rate applies to all except for waste with a density of greater than 1100 kilograms per cubic metres. Any waste over such density is assumed to be non-combustible, and is allowed to be landfilled at a lower tax rate. In 2005, there was a considerable increase to EUR 85 per tonne while the low tax increased slightly from EUR 13 to 14 per tonne. A tax on co-incineration also existed but is currently of no charge.

1)       A high rate for combustible and recyclable waste, 107.49/t Euro

2)      A low rate for non-combustible waste, 16.79/t Euro

Who monitors and collects..

The Landfill tax is collected by landfill operators, along with payment of the gate fee. The tax is passed onto the Dutch finance ministry. The simplistic design in this system creates a compliance of close to 100 per cent.

Leakage Issues

As a result of insufficient incineration capacities, until 2005 waste-producers choose between export to neighbouring countries or the acceptance of high landfill costs in Netherlands.

In order to avoid the landfill tax, between periods of 2002-2005, many combustible waste was shipped to Germany. This ended the abrupt implementation of a landfill ban in June 2005 in Germany.

In January 2007, the Netherlands opened their borders for the incineration of waste (both household and commercial/industrial) and kept closed the borders for the landfilling of combustible waste. This action was taken to stimulation the construction of more incineration capacity in Netherlands but so far there have been few significant quantities of cross border trade in combustible waste.

Revenues generated, how are they utilized?

The revenues from the Dutch landfill tax are not earmarked, and therefore comprises part of the overall budget. The revenues from the landfill tax are received by the Treasury Department. It is part of a scheme of greening the tax system, restrictions to undesirable activites are tax revenue generators for the Treasury (use of groundwater, pesticides, energy, packaging, etc.)

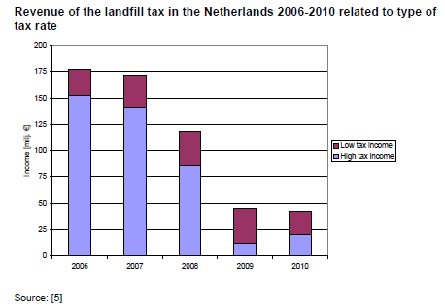
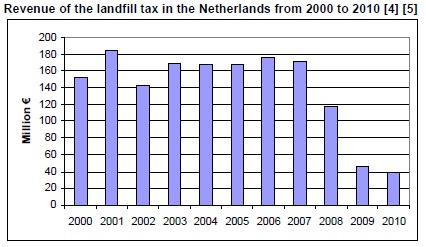
The revenue was the highest in 2001 and has been reasonably stable until 2008, where the revenue began to decrease and further decreased in 2009 and 2010.

Environmental Impacts


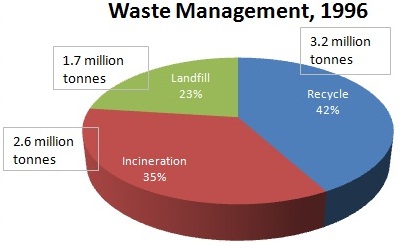
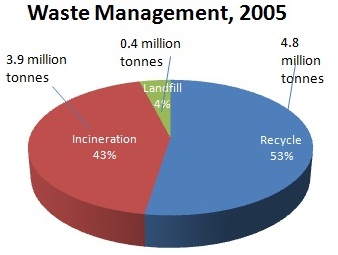
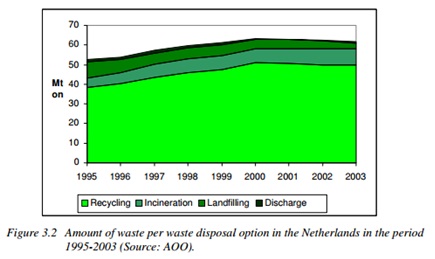
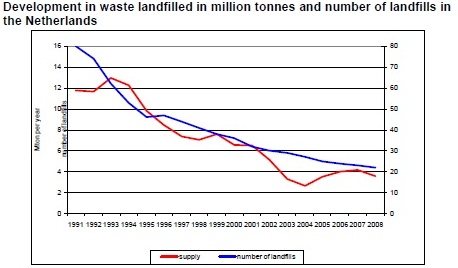
As shown above, many landfills were closed down after 1995. There is a continual decrease of landfill sites in operation alongside a decrease in supply of waste in landfilled.  Take 1996 and 2005, as comparative examples, we have seen significant improvements in comparison to 1992. Why?

Due to more diversion from landfill to recycling, and incineration, as shown below:


“Overview of the use of landfill taxes, Europe” http://scp.eionet.europa.eu/publications/WP2012_1/wp/WP2012_1


ibbid, http://scp.eionet.europa.eu/publications/WP2012_1/wp/WP2012_1


Economic Impacts

The combination of landfill ban with an increasing landfill tax was critical in bringing treatment capacity on-stream over the past few years. In particular, since 2002 when an increase in landfill tax was approximately EUR 80 per ton made landfill more expensive than other alternatives. Currently, the combination of tax and gate fees costs approximately EUR 127 per tonne to landfill a tonne of waste, which is significantly higher relative to EUR 90 per tonne for incineration. 

Changes in tax revenues:

ibbid, http://scp.eionet.europa.eu/publications/WP2012_1/wp/WP2012_1


ibbid, http://scp.eionet.europa.eu/publications/WP2012_1/wp/WP2012_1


Snapshot of the implementation results

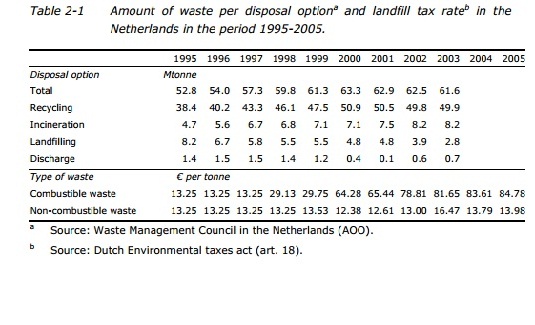
The landfill tax was introduced in 1995 at level of NLG 29,20 (Euro, 84.78 per tonne). In 2005, the rate has increased to 84,78 per tonne. In the period 1995 – 2003, the landfilled waste in the country decreased by around two thirds from 8,215 ktonne to 2,753 ktonne. During the same period, the amount of waste incinerated by around 75% from 4695 ktonne to 8218 ktonne. The amount recycled waste increased by around 30% in the same period from 38,435 ktonne to 49,936 ktone. These are not only the result of the landfill tax, but also a ban on the landfilling of combustible waste.

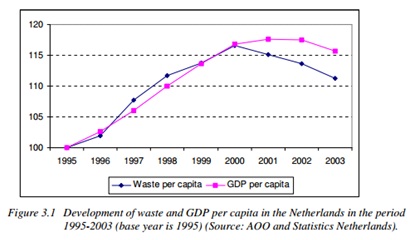
Source: http://www.ivm.vu.nl/en/Images/Effective%20landfill%20R05-05_tcm53-102678_tcm53-103947.pdf


From Fig 3.1, We can see the declining total amount of waste reduction per capita in 2001-2003.


 ibbid, Source: same as figure 3.1

In terms of policy effectiveness, landfill tax serves as an effective instrument to restrict both households and service sectors from over-producing. This is because when disposal costs are reflected in the charges to the waste producers, particularly in the case of the service sector, the landfill tax is essentially effective.

However, if the disposal charges are not imposed on the generators, landfill tax is deemed to be ineffective alongside the imposition of the landfill ban. It appears to be that the tax instrument is not fully binding. The only tool which has incentivized households to reduce landfill waste is the landfill ban. In other words, the landfill tax rate is not sufficiently high to be internalized within households. Thus, the government ought to raise taxes in order to account for losses in tax revenues and minimize the negative externalities of not having sufficient reduction of landfill waste from households.

From what I have learned from my environmental economics lectures, the main objective of an environmental tax policy is to raise the firm’s private marginal cost until it equates with social marginal cost. However, in the case of Netherland’s household sector, it has not fully achieved the socially efficient level of output due to overproducing landfill waste. The diagram below shows a tax equal to distance “E,” which is the level of damage caused at the optimal level of output.

 Landfill waste taxation policy (simplified, per-unit tax senario)


Source: http://ecomod.net/sites/default/files/document-conference/ecomod2006-rum/1382.pdf


Although environmental taxes are used more frequently to deal with negative externalities, prior to the policy and project implementations, there must be an ex-ante cost benefit analysis with the appropriate parameters specified, and suitable discount rates (capital rate of return in private sector) utilized upon benefits from the future periods. In effect, this would help us with choosing the suitable tax rate.

In general, the information from incinerational sources was adapted to Dutch situations. In particular, one needs to take into account the size of the population exposed to the local impacts of landfills and incineration plants.

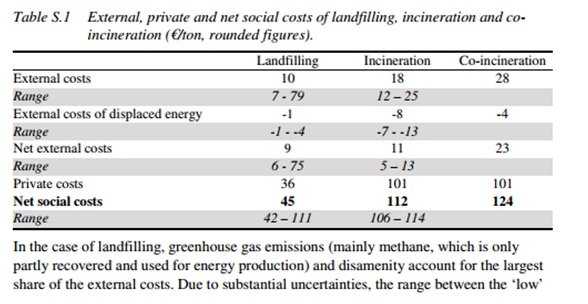
Table S.1 shows the estimates of external, private and net social costs for waste treatment options: landfilling, incineration, and co-incineration. “Negative” costs of displaced energy production are considered: 

ibbid, source: same as above (figures 3.1-3.2)

 From the data above, there is clearly no well-defined lowest social cost option. All we could say that on the outset, the net social cost of landfilling is lower than co-incineration. Thus, the minimal social cost solution is NOT zero landfilling, but instead a combination of landfilling (with methane recovery) and recycling could be a possible option. However, the country would need to have enough availability of landfill sites supply.

Given the fact that the Dutch tax rate on landfill is high at 80 Euro per tonne, the country could decrease tax rate for landfill and increase waste tax rate for incineration. However, if the waste tax rates for both landfilling and incineration are at 10, this could reverse incentive of diverting landfill waste to recycling and incineration significantly.

Alternatively, the country could explore the possibility of tradable landfill permits which combines the efficiency of a tax and a cap on landfill waste production. It also encourages waste producers with less efficiency in landfill waste reduction to either buy permits or adopt innovate technology to prevent or curtail waste production.

In addition, as economists, we need to determine whether explicit pollution taxes would be shooting one-self on the foot or an agent for corrective measures in resolving market failure. In fact, many argue that explicit taxes lead to government failure and a lack of improvements in sustainable efforts.

My criteria of evaluation involve the following:

1)  Revenue Neutrality 

In terms of tax collection, the Dutch system is rather simplistic. However, it is questionable whether the Treasury has achieved revenue neutrality when it has significantly increased the high landfill tax rateto 80 Euro in 2002. The conditionof neutrality only holds true if the government decrease taxes or increase benefits such as labour pensions, better low income welfare support.

2) The next best alternative after elimination of landfill tax

It might be more cost effective for governments to switch away from pollution taxation to direct subsidies to encourage greater innovation in designing cleaner production technologies. However, the Netherlands government would need to implement to subsidy with caution to ensure that subsidy is contributed to waste-reduction activities rather than the technology or the target group,  

 The impact of green taxes depends critically on the use of revenue flows. If they are balanced by reducing other taxes through ‘revenue recycling’, research suggests that green taxes could result in overall economic improvements

2)      Appropriate level of taxation?! Alternative ways to further enhance waste reduction…

It is difficult to quantify the benefits from landfill waste reduction if no proper monitory system is implemented. In the case of Netherlands, since the country is densely populated with a relatively small economy, it is not a draconian task for policy implementers to explicitly measure the monetary values of the benefits of reducing the externalities. The only challenging aspect would be how to best allocate resources into developing the incineration technology given that the capacity is limited within the country. Thus, there should not be restriction on incineration capacity both domestic and abroad. By allowing the export of combustible waste would capitalize the effectiveness of landfill tax, given that there is sufficient incineration capacities in neighbouring countries.

On the other hand, increase in the amounts of waste exportable to neighbouring countries for landfilling would significantly decrease the effectiveness of landfill taxes.. thus it simply creates a loss in tax revenues and a “spillover” of negative externalities to the neighbouring countries.

In addition, the government should take into account that the potential problems resulted from charging unit tax for landfill. For instance, dumping to neighbour’s bins, dispose of it at work, illegally dump waste or burn it themselves. This effect is evidently common especially when the elasticity of demand for disposal service is inelastic. This implies that waste producers are more price sensitive, thus an introduction of a unit price would cause the two effects: 1) reduction in waste 2) part of the reduction might be caused by illegal dumping

However, unit tax does have its advantage as it encourages households to increase prevention and home composting.  In addition, even when there is illegal dumping, as long as the value for recycling is positive, the unit-base pricing would provide the second best optimum. On the other hand, if the value of the waste material is worthless, then another policy like the deposit-refund system should be considered.

3)      Consumer welfare effects

In terms of an increase in landfill taxes, it increases prices which can impose an adverse effect on consumer welfare. Depending on the incidence of tax burden, for low income households, payment to landfill taxes can serve as a large proportion of their income. Thus, the government should consider a tax rebate for households that achieved a certain quantity of reduction in landfill on a quarterly basis. Alternatively, government could change the tax policy to make the large households with higher waste production pay a premium once they have reached the bylaw threshold, and additional per unit charges apply hereinafter.  

4)      Employment and Investment Consequences

If incineration waste taxes, and landfill waste taxes are raised in one country, this would develop structural unemployment due to a shift in production to other countries with lower tax rates.  Globally speaking, the new welfare effect has not changed, since this outcome is merely a transfer of waste from one country to another. Consequently, the country would face high unemployment and a loss of international competitiveness. Thus, with a higher taxation would lead to a decline in profits and a fall in the flow of both foreign direct investments and domestic investments, which generates positive externalities in reducing energy intensity of an industry or innovation to improve the environment.

Lesson Learned

Both the landfill ban and fiscal and legislative measures help diversion of waste away from landfill to alternatives. However, it is difficult to distinguish whether the positive externalities arises from landfill tax or the landfill ban itself. The taxation policy in the Netherlands is, in general, effective. It is evident that there are reductions in landfill waste as industries and households start using alternative waste processing such as incinerations, and are becoming increasingly environmentally conscious through reduction, recycle, and more means of prevention. Although there are still certain loopholes for illegal dumping, and ineffective diversion of waste, it is difficult to get around with it. (Given the simplistic nature of the tax and monitory system).  

References

Barellings Helen; Beukering Pieter; Kuik Onno; Linderhof, Vincent; Oosterhuis, Frans. Effectiveness ofLandfill Taxation. Novemeber 24, 2005.<<http://www.ivm.vu.nl/en/Images/Effective%20landfill%20R05-05_tcm53-102678_tcm53-103947.pdf>>.

Barellings, Helen & Linderhof, Vincent. Istitutute for environmental studies (IVM). <<http://ecomod.net/sites/default/files/document-conference/ecomod2006-rum/1382.pdf>>

European Topic centre on Sustainable Consumption and Production (EIONET).The Netherlands Fact Sheet. <<http://scp.eionet.europa.eu/facts/factsheets_waste/2009_edition/factsheet?country=NL>>.

Fischer, Christian; Lerhner, Mathias, McKinnon, David. EIONET. “Overview on the use of European Landfill taxes.”<<http://scp.eionet.europa.eu/publications/WP2012_1/wp/WP2012_1>>

Indian Ocean Commission. <<http://environment.ioconline.org/fr/solid-waste-management/micro-composting-and-seperate-collection-of-biodegradable-waste.html>>.

UCD Dublin. “Economic Instruments for Evironmental Policy.” <http://www.economicinstruments.com/index.php/component/zine/article/280>.

Carbon Policy in Switzerland

In 2010, the Swiss Confederation implemented the greenhouse gas emission trading systems (ETS) along with the other European Union countries.

Overview of the ETS

The ETS is basically a “cap and trade” system which provides a quota or cap on the overall level of emissions. This market allows participants to trade permit to pollute. In effect, the permits or allowances serve as a currency with the ETS carbon market. Each one gives the permit owner the right the emit one tonne of CO2. This system is effective in a sense that the cap is imposed on the total number of allowances, which allows market scarcity to drive incentives to reduce emissions to an optimal level.

The ETS involves over 10,000 individual installations with heat excess of 20 megawatts in energy-intensive sectors, such as electricity and heat generation, meal production and chemicals. In aggregate, this is approximately half of EU’s CO2 emissions and 40% of total green house gas emissions.

ETS in Switzerland

Switzerland operates as a voluntary alternative to a domestic fuel tax with 40 companies that covers 6.9% of Switzerland’s 52 Mt of annual CO2 emissions. From 2012 and onwards, the ETS has been extended to the aviation industry.

Switzerland’s carbon emissions and tax policy

Main sources of CO2 emissions: oil used in transportation and space heating (40%), combustible and renewable waste (7%), and fossil fuel (53%) as of year

Policy to curtail emissions: CO2 tax is implemented to have polluters to finance for decarbonisation efforts in space heating

Counter-factual environmental taxes: consumption of final and intermediate carbon-intensive inputs, which is also adopted in Finland and Norway

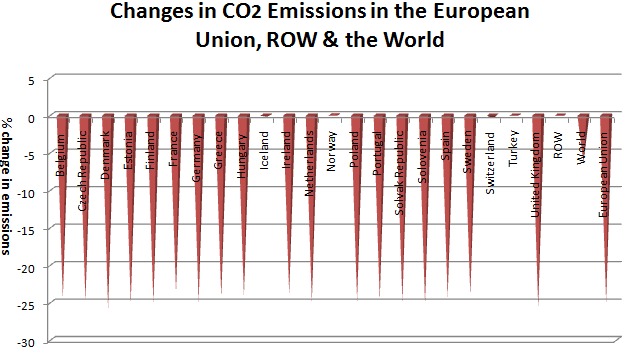
Back in 2009, the European Union and Switzerland set a target of a 20-30% reduction in emissions relative to 1990. The result shows that Switzerland is on the sensible lower bound of the pledged target reduction in CO2 emissions relative to the world.

Tax on CO2 intensive inputs

In regards to inputs, Switzerland has introduced such form of carbon tax under the Copenhagen Accord.

Factors causing major shortfalls in the Copenhagen Accord:

1)      The agreement between nations is not legally binding. Rather, it is through voluntary, unilateral measures (ie: domestic tax).

2)      Heterogeneous targets for emission levels across countries

Tax rates are necessary to achieve targets on a variable basis. In fact, tax brackets are identical across the European Union member countries in which the members implemented a coordinated environmental policy.
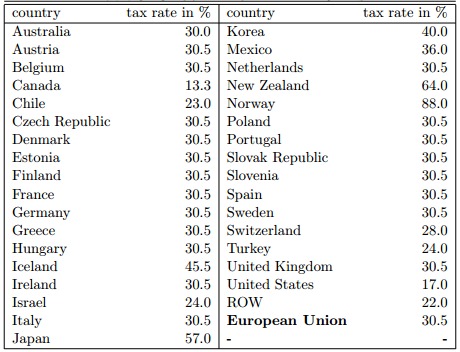
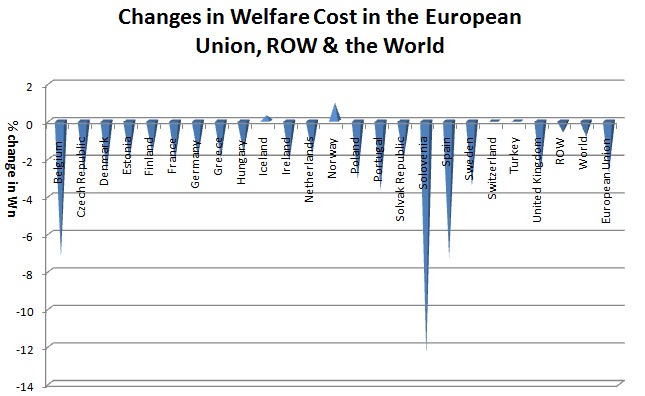
Thus, the European Union has a uniform target of a 25% reduction in CO2 emissions and a uniform tax rate of 30.5% across all member countries. The worldwide impact is that there is a cutback in level of emissions of 6.4% reduction in cost of the European Union’s total welfare, though the welfare effect varies within individual countries.

Note that Welfare Cost, Wn is denoted as the % change. It is calculated as follows:
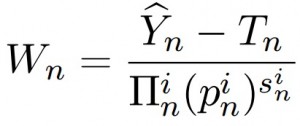


Where  Y ̂n denotes the changes of nominal GDP in response to the imposition or the change in carbon tax. In this case, we deflate the change in nominal income of consumers in n by the aggregate prices normalized by consumption share parameters.


Without coordinated efforts, the consequences of aggregate carbon emissions would not be taken into account.

  •  Result: Geographical reallocation of polluting industries, in which efforts in energy use reductions in some countries are partially offset by carbon leakage

Thus, it is important to have policy alignment across countries in order to reduce effort of individual countries relative to uncoordinated implementation. This is due to the fact that domestic tax policies only provides second order indirect effect on the rest of the world.

Switzerland’s case as a small open economy (S.O.E.)

Firm’s Options for abatement activities and carbon emissions:

1)      Participate in Switzerland’s cap and trade program, given that firms are committed to “cleaner” environmental technologies

Advantage: exempts firms from environmental taxes, which was 36 Swiss Franx per ton of carbon back in 2011

2)      Pay for the carbon tax as specified in the federal law on the reduction of carbon emissions

The Swiss government implements a direct carbon tax and distributes annual tradable permits throughout the year. According to the Copenhagen accord, Switzerland’s unconditional target of reduction in CO2 emissions is 23% relative to 2000.
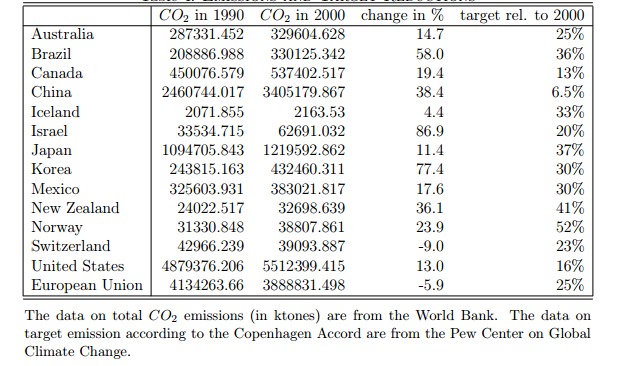
In general, the effect of Switzerland’s domestic policies has a relatively small impact to the world since it is a small open economy.

Based on the analysis from the Economic Suisse Journal, to achieve a 23% reduction in carbon emissions, Switzerland would need to set carbon tax at 28% in 2000 which translates to 57.2 Swiss Francs per ton of tax (as in 2011).

Normalizing using the real GDP deflator for 2000 and 2011:

Taxn = 0.28 * (YnCO2 / CO2)* deflator

If the Switzerland and the EU countries comply with their target reduction in which the European Union member countries implement a carbon tax of 30.5%, Switzerland will be able to meet its target of CO2 reductions using a slightly lower tax of 53.1 Swiss Francs than implementing alone (57.2 Swiss Francs as in 2011 terms).

It is important to note that if both the European Union countries and Switzerland implemented their environmental policies, this would be beneficial for the world through lower CO2 emissions.

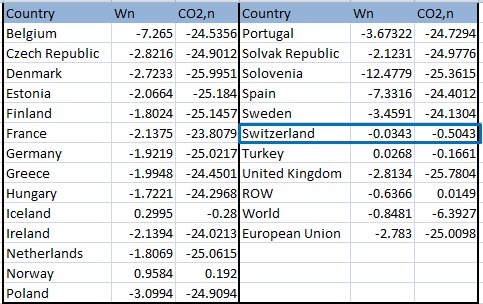
Data in Egger, and Nigai’s “Energy Reform Switzerland” suggests that the world level of carbon emissions of the OECD would fall by 8.6%. Switzerland and the European Union would have a change in welfare costs of -1.7% and -2.8%, respectively. See graphics and tabulation below.

In Switzerland`s case, it has higher welfare costs relative to the European Union. Since it is committed to more severe reductions in the Copenhagen Pledges, and as a small open economy, the competitive effects of tax policies have more adverse impacts than other large open economies.

Kyoto Protocol 

At the 2012, Doha Climate Change Talk, Switzerland entered the second round of commitment in which they agreed to reduce emissions in 1 January 2013 to December 2020. By signing the Kyoto Protocol, it guaranteed that the nation would reduce emission of CO2 by an average of 8%.

The Swiss government took an innovative approach in terms of implementation of carbon incentive tax.

There are three pillars involved from the carbon incentive tax scheme:

1)      The collected carbon tax revenue flows back to the industry and the households to finance energy saving projects.

2)      All carbon projects are driven by local initiatives with a decentralized approach which serves as an important feature of the scheme.

3)      Energy intensive sector can ask for a tax exemption if they contract a reduction of CO2 emissions. However, by having this tax benefit, these energy-intensive businesses are ineligible to obtain financial assistance from the energy fund.

If we look at the distributional effects, all of the three pillars above contribute to a greater incentive among workers, industry, and all other polluters in general to cut back on emissions.

As we can see, the first pillar focuses on taxation to polluters, which results in reduction in greenhouse gas emissions. The second pillar illustrates the money flows back into the industry proportional to the annual salaries paid to the workforce.  Last but not least, this carbon tax scheme generates industry profits in two manners. First, sectors with relatively high energy efficiency pay less than the high polluting sectors. At the same time, they can also exploit the benefit of being eligible to receive a tax refund depending on their wage-bill. In essence, the government encourage businesses to innovate for higher energy efficiency. Consequently, the industry enjoys a two-fold benefit in terms of cost reduction, thereby becoming more competitive.

In terms of SMEs support, the local Swiss initiative for carbon footprint reduction was created by The Swiss Climate Foundation, which serves as an non-profit agency to encourage voluntary energy reduction, energy efficiency, and climate protection projects for the development and marketing of innovative products and technologies.

Note: The Swiss government implemented the carbon incentive tax since 2008. Swiss companies can be exempt from the tax if they participate in the country’s emissions trading system. The tax amounts to CHF 36 per metric tonne CO2.

July 2012, Nuclear Phase Out Plan 

According to the IEA (International Energy Agency), Switzerland is in transition to a low-carbon economy by seeking to reduce green house has emission by a fifth by 2020, phasing out nuclear power. Even though, on the outset, it is appealing to the Swiss electricity reforms and generates high oil and gas security levels, the energy policy review in IEA foresees challenges in terms of stabilization of electricity demand.

The goal is to provide stable, long term conditions for energy market participants in 2050. IEA reports indicate that Switzerland`s significant cross-border electricity flows and its reservoir alongside plum-storage hydro-power plants could serve as good energy sources for the wider region.

Phase out plan details:

Gradual decision, in which it might take longer than the anticipated end-of-operation period from 2019-34.

As of 2012, the nuclear reactors generate 40% of the electricity in Switzerland. Given operating lifespans of 50 years, the first Swiss reactor to shut could be Beznau 1 in 2019, followed by Beznau 2 in 2021.Followed by the shutdown of Mühleberg around 2022. Last but not least, the largest units: Gösgen with 985 MWe and Leibstadt with 1165 MWe would likely to be closed in 2029 and 2034 respectively.

However, in reality, there is no notion of operational lifetime. According to the Swiss law. NPPs may operate as long as the safety criteria is met.

It is anticipated that over the longer term after 2020, the separate taxation schemes in energy and CO2 would be abolished, and would gradually be substituted by an overall energy tax, which would have a steering effect on the energy demand. New financial and institutional incentives arises as CO2 tax and tariffs has increased, and so as the eligibility of individual remuneration in technologies.

Reduction in green house gas emissions (GHG)

In terms of reduction in green house gas emissions, the target is to reduce GHG by 20% from 1990-2020. Since most carbon emission sources comes from oil use in transportation and space heating, space heating and process heat are involved in most of the carbon tax for financing decarbonisation efforts.

It is anticipated that stronger efforts will be required to reduce emissions from road transport. For end-use sectors, road transport accounts for the largest CO2 emission throughout the country, and has the most potential for further improvements in terms of abatement.

One of the important initiatives is the fleet-wide CO2 limits on new passenger cars that will take full effect in 2015.

For several years, the government has worked on improving the standard of public transit system. There were successful efforts in changes of freight traffic from road to rail. In addition, heavy vehicle fee has been levied to the emitters.

With respect to the building sector, the emissions is also high due to a large share of oil of over 50% is used in heating. Thus, Switzerland should implement more accelerated programmes and plans to adopt heat pumps and renewable energy sources for reductions in carbon emissions. In other words, the country should still work on improving incentives to increase energy saving innovations in rental dwellings; since it is a country with high share of tenants.

Problem of “Effect & voluntary” measures

This policy approach in Switzerland is deemed as ineffective, since market players are exempted from tax if they voluntarily fulfill the pre-agreed targets. However, as the need to reduce carbon dioxide emissions becomes increasingly urgent, the price-based instruments should be used more extensively.

In this manner, with higher CO2 tax rates,this helps incentivize more investments in R&D and technological innovations.

Important Policy Recommendations:

For long-term stability, the Government of Switzerland should:

1)      Develop a sound and solid regulatory and policy framework in regards to the Energy Strategy 2050

2)      Adopt reduction in domestic CO2 emissions in a cost effective manner by delivering  a detailed strategic plan

3)      Amidst the trend of ever-increasing energy demand, take action to rise incentives for electricity grids investments and increase market integration across borders

4)      Closer integration with the European energy markets and extend alignment of energy policies with the rest of the European Union countries

————————————————————————————————-

The CCS Incentive – Carbon Capture & Storage

Countries involved: The European Union, North America, and Australia

Objective: To help with mass deployment by reducing emission in a cost effective manner

Challenges: Changes in policy – difficult to predict because it depends on sthe stages it takes for alternative technologies to mature

How can CCS become an effective initiative? In all the participating countries, each of the government needs to have a combination of policy that addresses various dimensions of market failure.

Project stage – technically immature in terms of integration of carbon capture, transportation, and storage in full scale.

We would need a market for CO2 capture to have enhanced oil recovery.

Figure 1 – Current carbon prices from EU emission trading scheme or clear development mechanism
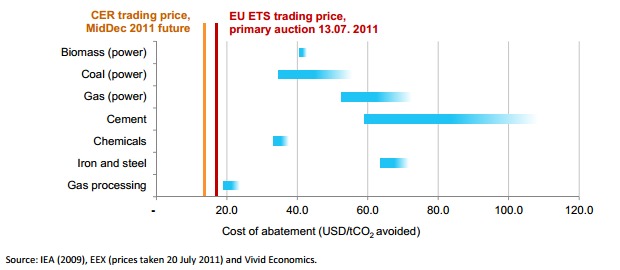
What are the future prospects? R&D and experience from existing projects can reduce costs, while increasing carbon prices will boost revenues. Recently, there has been demonstration programs launched in the European Union, Australia and North America.

By examining the IEA BLUE Map scenario, by 2050, the CO2 emission from energy use will be 50% of their 2005 level and 19% of total emissions reduction arises from CCS.

Policy involves four aspects:

  • Funding for capital deployment and operations
  • Costs & risks: either public or private
  • Subsidies or penalties
  • Technological support: CCS specific incentives (ie: technology neutral incentives)

Developmental phases for CCS Policy framework

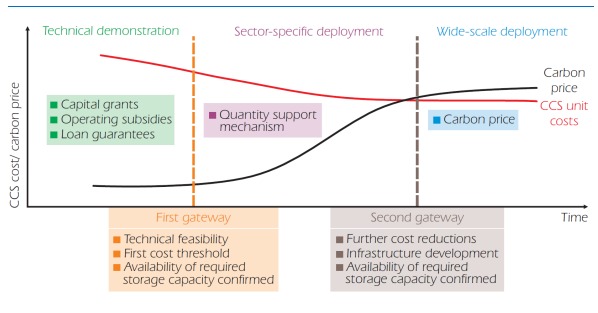
1)      Public capital grants and opening subsidies to test the efficacy of technology

2)      Determine how the CCS costs can be covered (partially through carbon price  and support from a certain private/public sector) which involves implicit financing with subsidies.

From the government: CO2 contracts

From the private sector: portfolio standards

Through optimizing the cost distribution, it helps develop lowest-cost supply of CO2 for commercial usage.

3)      Maturity stage involves long term infrastructure development through stable economy-wide carbon price

Figure 2 — Possible Gateways within a CSS policy framework 
Motivations behind the CCS incentive (Reasons for policy intervention)

1)      Externality: when a firm’s action causes impacts on others which it fails to take into account. ie: releasing excessive amounts of CO2 from fossil fuel combustion.

As more countries to join the CCS incentive, it helps increase economies of scale by improving cost effectiveness .. thereby reducing negative externalities

2)      Public good: intervention helps incentivize the implementation of CCS policy which explicitly enable the diffusion of knowledge and from R&D demonstration projects throughout various nations

3)      Imperfect competition: when the market is too concentrated with power where a few firms dominates, it affects price by having a few firms dictating output supply decision in the market. In the case of CO2 pipeline networks, one firm maybe unwilling to offer access to other firms on fair and reasonable terms. Consequently, with a restrictive access, the network would become too small of an extent and capacity, thereby driving up pipeline and storage prices.

4) Information asymmetry and imperfect information: investors are unable to discern good projects from bad projects. Given that information on CCS costs and performance is most probably unequally distributed, this would hold back investments in good projects.

5) Complementary markets: Imperfect coordination in output production and delivery could lead to an undersupplied capacity. This instance could occur if the vertically-integrated chain for CO2 capture and storage system are under different ownership such that investors are subject to numerous uncertainties and risk factors in the capture units and the storage space. They might be reluctant to commit funds into the CCS projects.

Based on these five factors, it is critical to have a set of policies that can correctly anticipate and minimize market failures.

References

Bruno, Zeller & Longo Michael. p.195 “Carbon Reduction Legislation in Australia” <<http://www.businessandeconomics.mq.edu.au/our_departments/accounting_and_corporate_governance/docs/publications/past_editions/volume_8/08Longo.pdf>>

Egger, Peter & Nigai Sergey. “Energy Reform in Switzerland, a quantification of carbon taxation and nuclear energy substitution effects.” <<http://www.economiesuisse.ch/de/SiteCollectionDocuments/20130130_Studie_ES2050_def.pdf>>.

“EU to link its Green House Gas Trading Permit System with Switzerland.” Council of European Union. December 20, 2010. <<http://www.consilium.europa.eu/uedocs/cms_data/docs/pressdata/en/envir/118632.pdf>>.

“IEA, OECD Report on Switzerland’s electricity market reform, 2012.” <<http://www.iea.org/Textbase/npsum/switzerland2012sum.pdf>>.

“IEA review of Swiss Energy Policies.” International Energy Agency. July 3, 2012.<<http://www.iea.org/newsroomandevents/pressreleases/2012/july/name,28156,en.html>>.

“Switzerland challenging energy policy.” WNN. July 3, 2012. <<http://www.world-nuclear-news.org/EE-Switzerlands_challenging_energy_policy-0307124.html>>.

“Switzerland moves to join carbon market.” December 21, 2010. EurActiv. <<http://www.euractiv.com/climate-environment/switzerland-moves-join-europe-ca-news-500813>>.
 

February 5, 2013Permalink 5 Comments

Enbridge Hearing – Edmonton (January 29th, 2013)

http://www.cbc.ca/news/canada/edmonton/story/2012/09/18/enbridge-hearing.html

The benefits of the Enbridge Pipeline might be exaggerated.

A lawyer for the First Nation claims that much of the land the pipeline would travel though nearly $1.5 billion a year in increased revenue by 2018 are inflated.

The estimate Enbridge (TSX:ENB) at the Energy Board suggested oil supply in Western Canada will grow by 6.5% a year between 2011 and 2020. (TSX:ENB)

The environmental economist said that the information was analyzed inside the 50-metre pipeline, but other effects were ignored outside of the corridor.

It evident that there are many adverse ecological effects disturbed by the pipeline that cannot be monetized.

Enbridge is currently working with the Nature Conservancy to protect land that would offset areas disturbed by the project.

Northern Gateway Pipeline Critics over Foreign funding

http://www.theglobeandmail.com/news/politics/enbridge-questions-northern-gateway-pipeline-critics-over-foreign-funding/article4597466/

I have just come across ab interesting article from the Gloebandmail on Enbridge Pipeline.

Here are a few highlights:

Enbridge raises substantially more funds for the project itself rather than more for effort of wild life, and community conservation.

British Columbians are unclear about the investors who co-invested with Enbridge in the pipeline Project.

Currently, there has been some collaborate work for ocean management plan amongst first nations, the province, commercial fishermen, shipping interests, tourism operators, local governments, environmentalists and the oil and gas sector.

According to the 2011 internal fisheries and oceans update, the proponents, as well as the oil and gas and shipping industries, are concerned that ongoing third-party funding influence on the Integrated Oceans Management plan, and the outcomes for the panel review of the project.


Enbridge Pipeline – how do we weigh in costs and benefits?

My Questions on the Enbridge Pipeline – can it be economically viable and at the same time align with sustainability goals?

Recently, there has been a heated discussion on the controversy of Enbridge Pipeline.. the fact that Canadians are generating more exports for oil to Asia creates potential economic benefits, but at the same time this project generates detrimental effects on the livelihoods of the native people in Athabasca,  and especially those that consume local wild salmon as the main source of their food staple (as the fish stock shrinks).

We can conduct a cost benefit analysis to see whether Enbridge Pipeline is a project should be undertaken, under the following criteria:

1) Efficiency: does the project take into account the negative externalities such as oil spills, and noise pollution which affects the natural inhabitat? If so, did the project design and implementation teams collaborate together? In otherwords, were these external costs being taken into account through investing in cleaner technology, and more precautionary measures for oil transportation and extraction?

2) Effectiveness: Did the project implementers and designers communicate adequately with the biologists, and local stakeholders to ensure contamination in food chain/ecosystem is minimized? Whether the project cost is efficient enough to be both economically beneficial, and sustainable? OR simply a trade off between economic efficiency and sustainability?

If there is a trade off, how can we ensure the next generations would enjoy the same quantity and quality of natural capital (such as forest, salmon, and  oil) as the current generation?


Cool sources of info – Week X

http://www.agweb.com/crops/soybeans.aspx

–> Gives us useful comments on crops, harvest news and updates, news guide on  grain commodities, cotton, hay and seeds.

http://www.forexpros.com/commodities/us-soybeans-technical

–> Data and indicators on technical analysis

http://www.farms.com/Commentaries/video-what-could-changes-to-the-canada-grain-act-mean-to-my-farm-57315.aspx

–> Insights: Canadian Grain Act and effects in the grain industry

How does it affect farmers? What role does it play in grain trade? Supply chain risk management for farmers.

Road Ahead – Week X

In the real world, technical analysis is definitely useful especially looking at short term trends using geometric methods such as descending vs. ascending triangles, head and shoulders etc.

I also find candle light charts helpful in understanding trade volume difference in open and close along with high and low in price, which reflect forces of supply and demand in the futures market.

The annotated example in the chart shows a stock that has a gap opened up. Prior to the open, the buy orders quantity is above that of sell orders, and the price increased to attract more sellers. Initially, there was a rapidly increasing demand. And thus, the intra-day low reflects the availability of supply (sellers). The close represents final price agreed by the buyers and sellers. It is below the high and closer to the low. This illustrates that despite of having a strong demand from buyers during the day, it is ultimately supply that prevailed and put downward pressure of the price. Here, we observe the battle between supply and demand. So basically, higher prices reflect a surge in demand, and lower prices reflect an increase in supply.

If I learned technical analysis earlier on, it would have been useful in predicting futures price based on the pattern or trend analysis.


Source: stockcharts.com (technical analysis overview)