In the lab this week, we were giving a task to create a map of Vancouver city identifying the potential areas which are at risk from Tsunami and/or storm serge due to the the changing climate in recent years. The analysis shows that there is around 12% of City of Vancouver’s total area in danger from possible tsunami/storm surge. By using clip command (extracting only the features that overlap between two input data, More at Clip) and selection by attributes (More at Select by attributes), I was able to identify the health care and educational facilities within the City of Vancouver danger zone. They are as following:
- False Creek Residence
- Villa Cathay Care Home
- Broadway Pentecostal Lodge
- Yaletown House Society
- Emily Carr Institution of Art & Design (ECIAD)
- Henry Hudson Elementary
- False Creek Elementary
- St. Anthony of Padua
- Ecole Rose des Vents.
These facilities appear in burgundy points on Map 1, alongside types of land use categorized by colour and the major roads at risk with their locations.
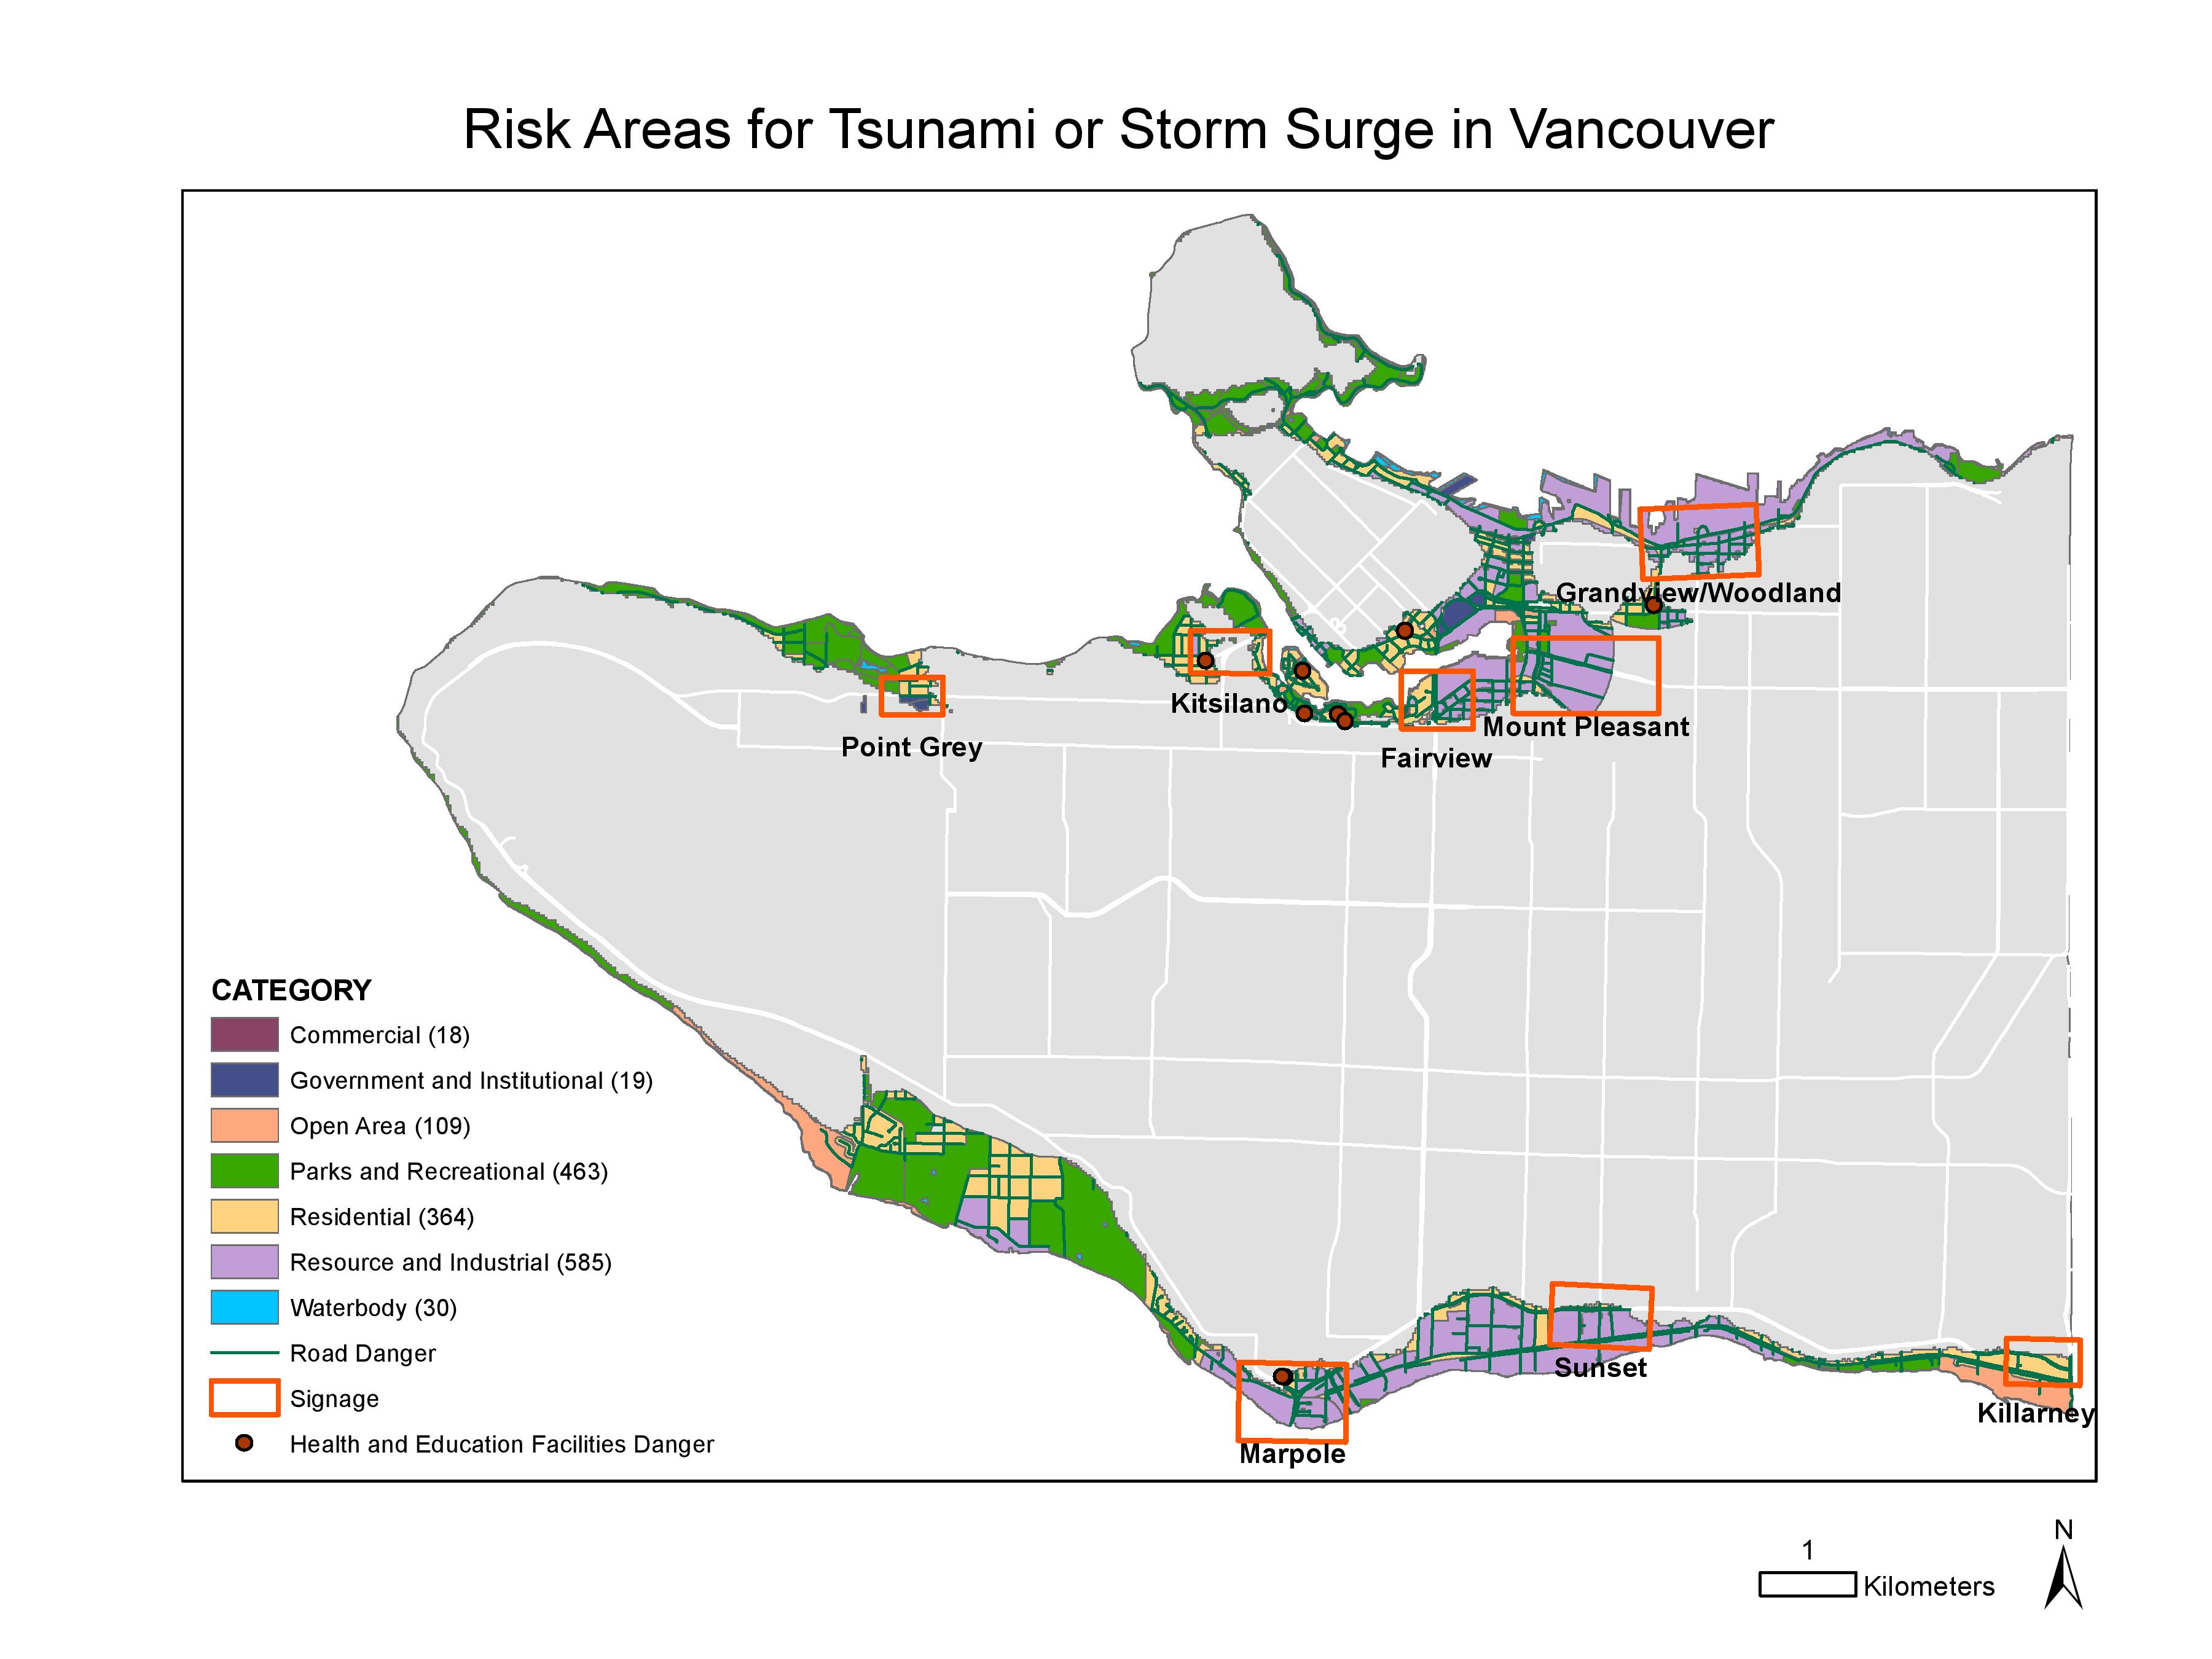
Map1: Risk areas for Tsunami or storm surge in Vancouver
Moreover, since there is a project proposal for the new St. Paul Hospital designated in the Mount Pleasant neighbourhood, I made an additional map, below, to visualize the potential risk of the site from flooding. This is due to its lowland location that contributes to a high possibility of flood damage to the new hospital site, if the city of Vancouver is hit by Tsunami.
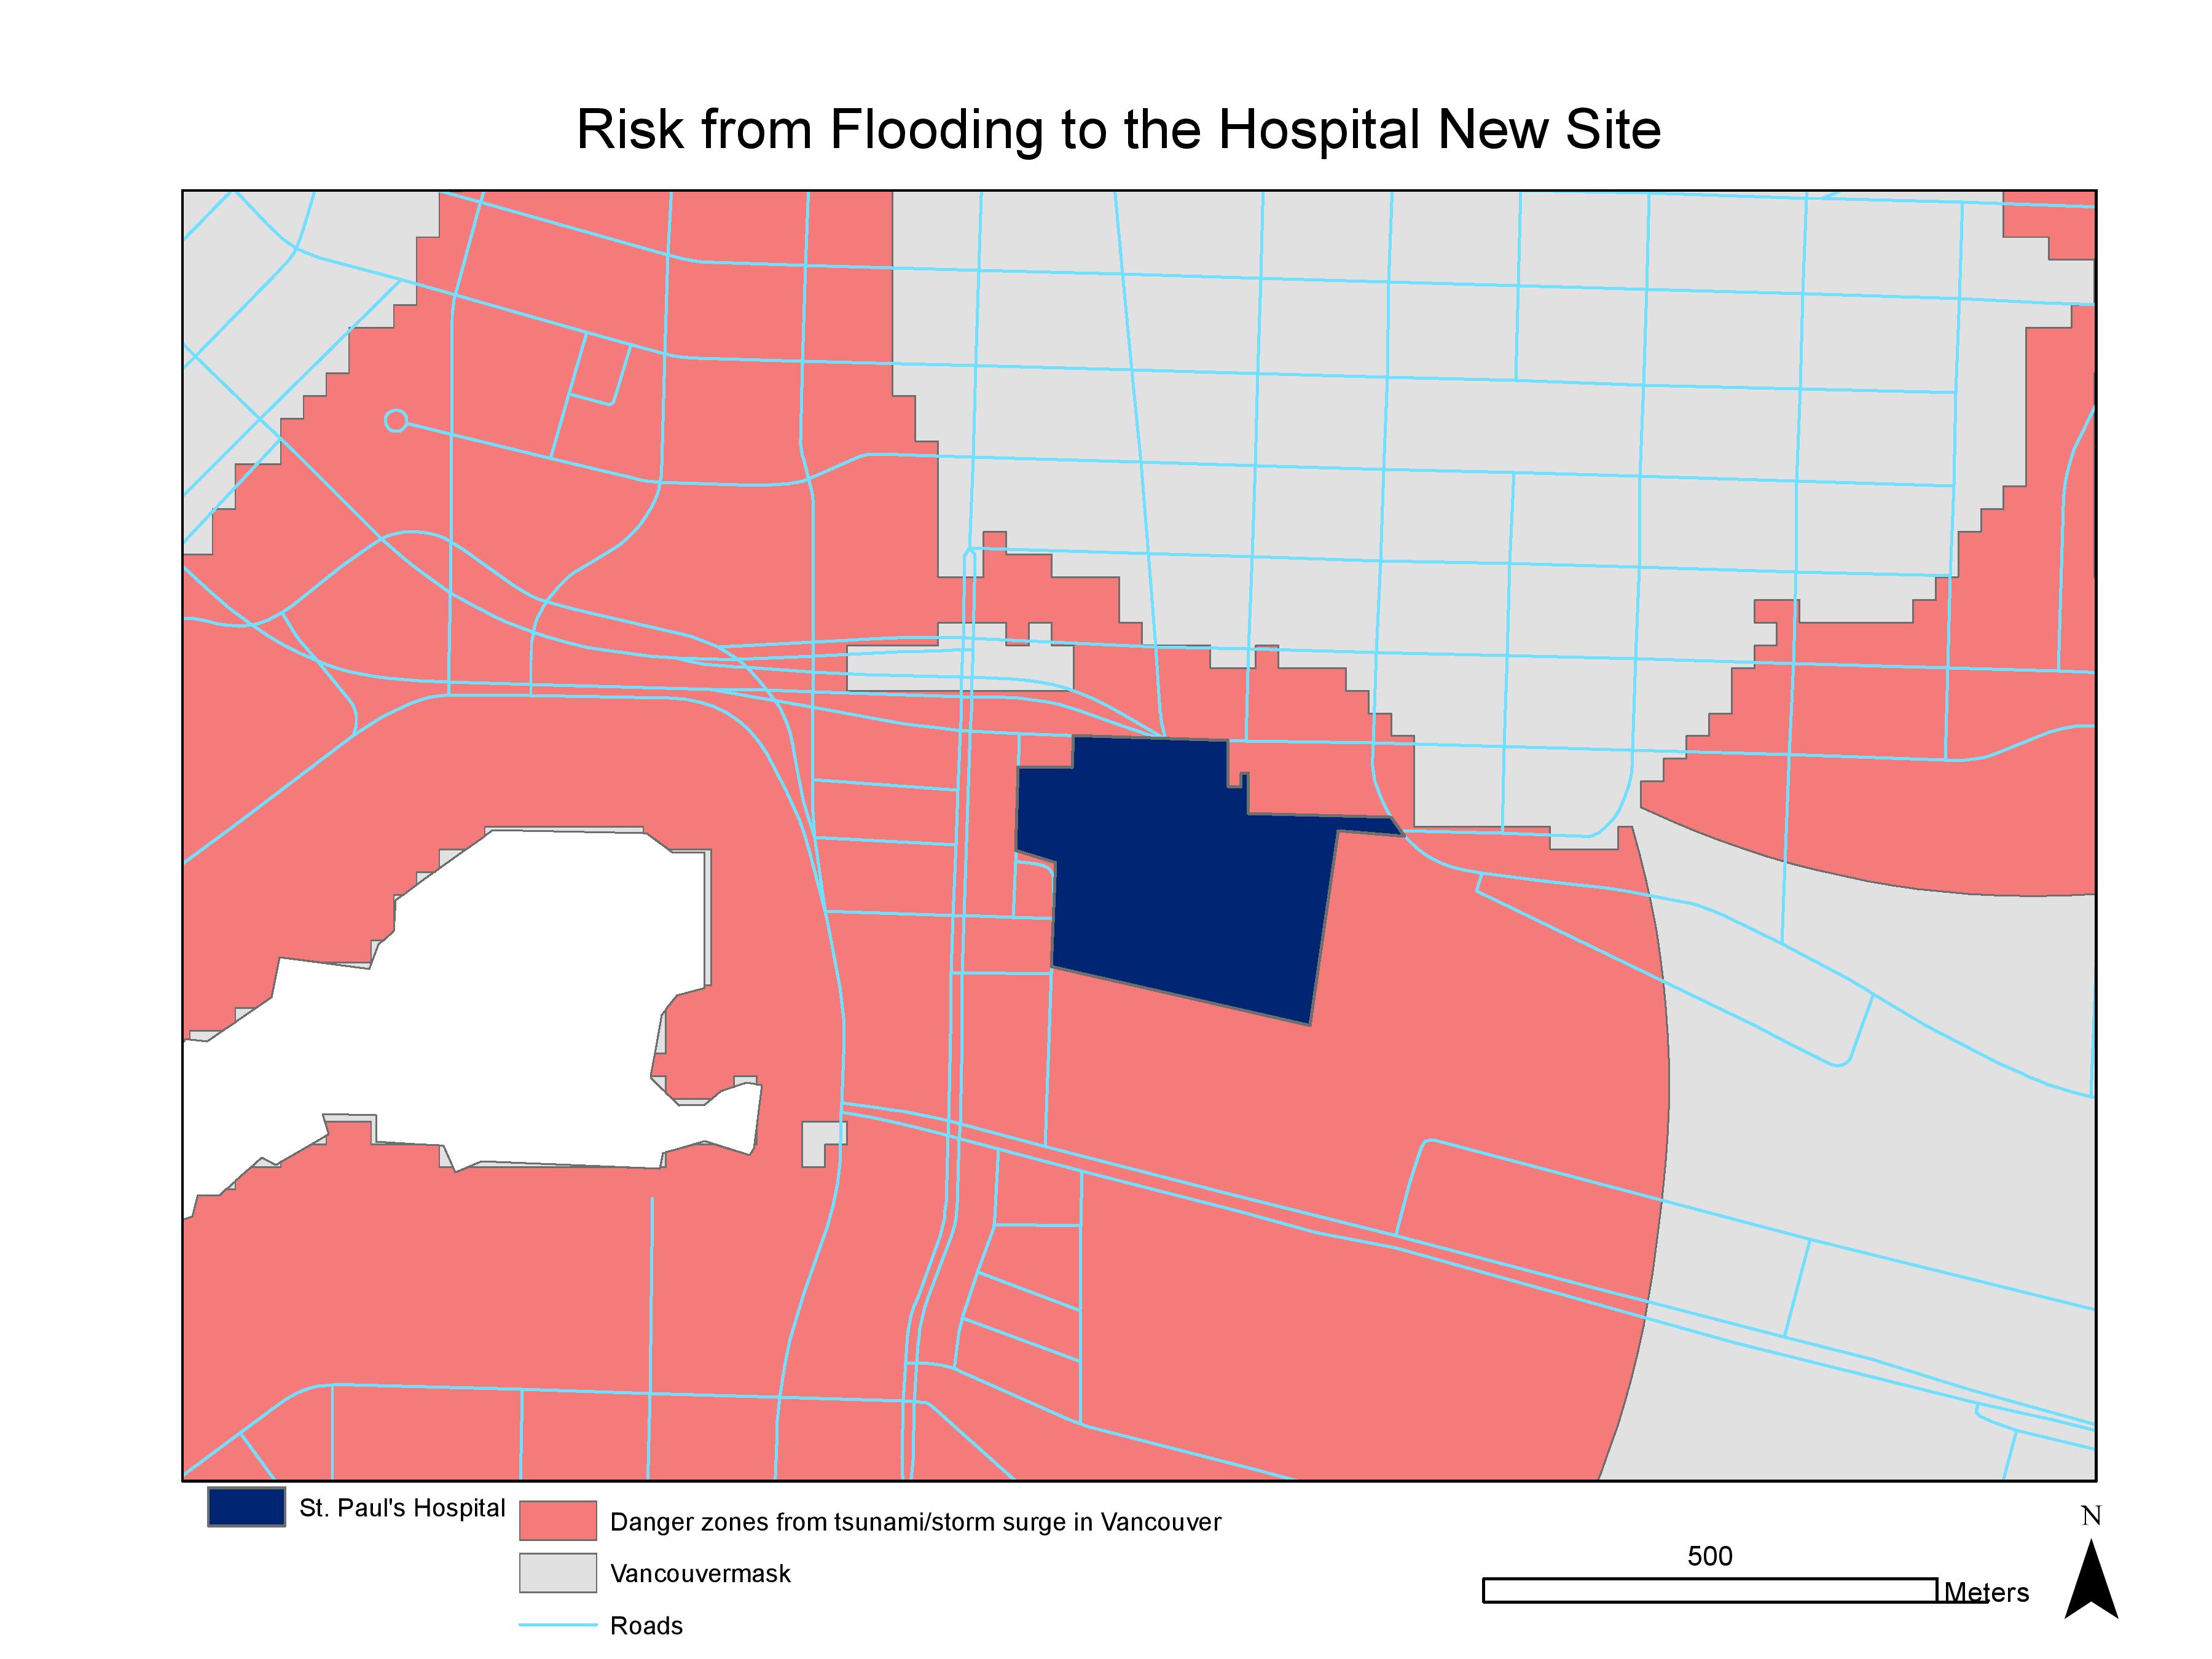
Map2- Risk from flooding to the hospital new site
×W’s picked-up skills×
- familiarized initially with the program’s variety of tools (buffer, clip, reclassification, selection by location etc.) for future proficient usage
- integrated both spatial and tabular datasets in creating a map of risk areas from Tsunami in Vancouver
- calculated areas of the risk zones through the summary table for each type of affected land uses as part of the impact analysis