Before we could find suitable locations for wildlife crossings, we needed to determine the criteria for choosing a location. Since we couldn’t find papers explaining the criteria, we decided to use analysis and theory to determine our criteria. One criterion was land use, we realized that unless the bridge connected forested areas to forested areas it doesn’t serve much benefit to wildlife. Another factor was the density of wildlife collisions, areas where more animals are being hit are likely areas where more animals are trying to cross the road. The final criterion was the slope of the land since it needed to be relatively flat in order to easily build infrastructure.
Finding Attributes of Banff Crossings
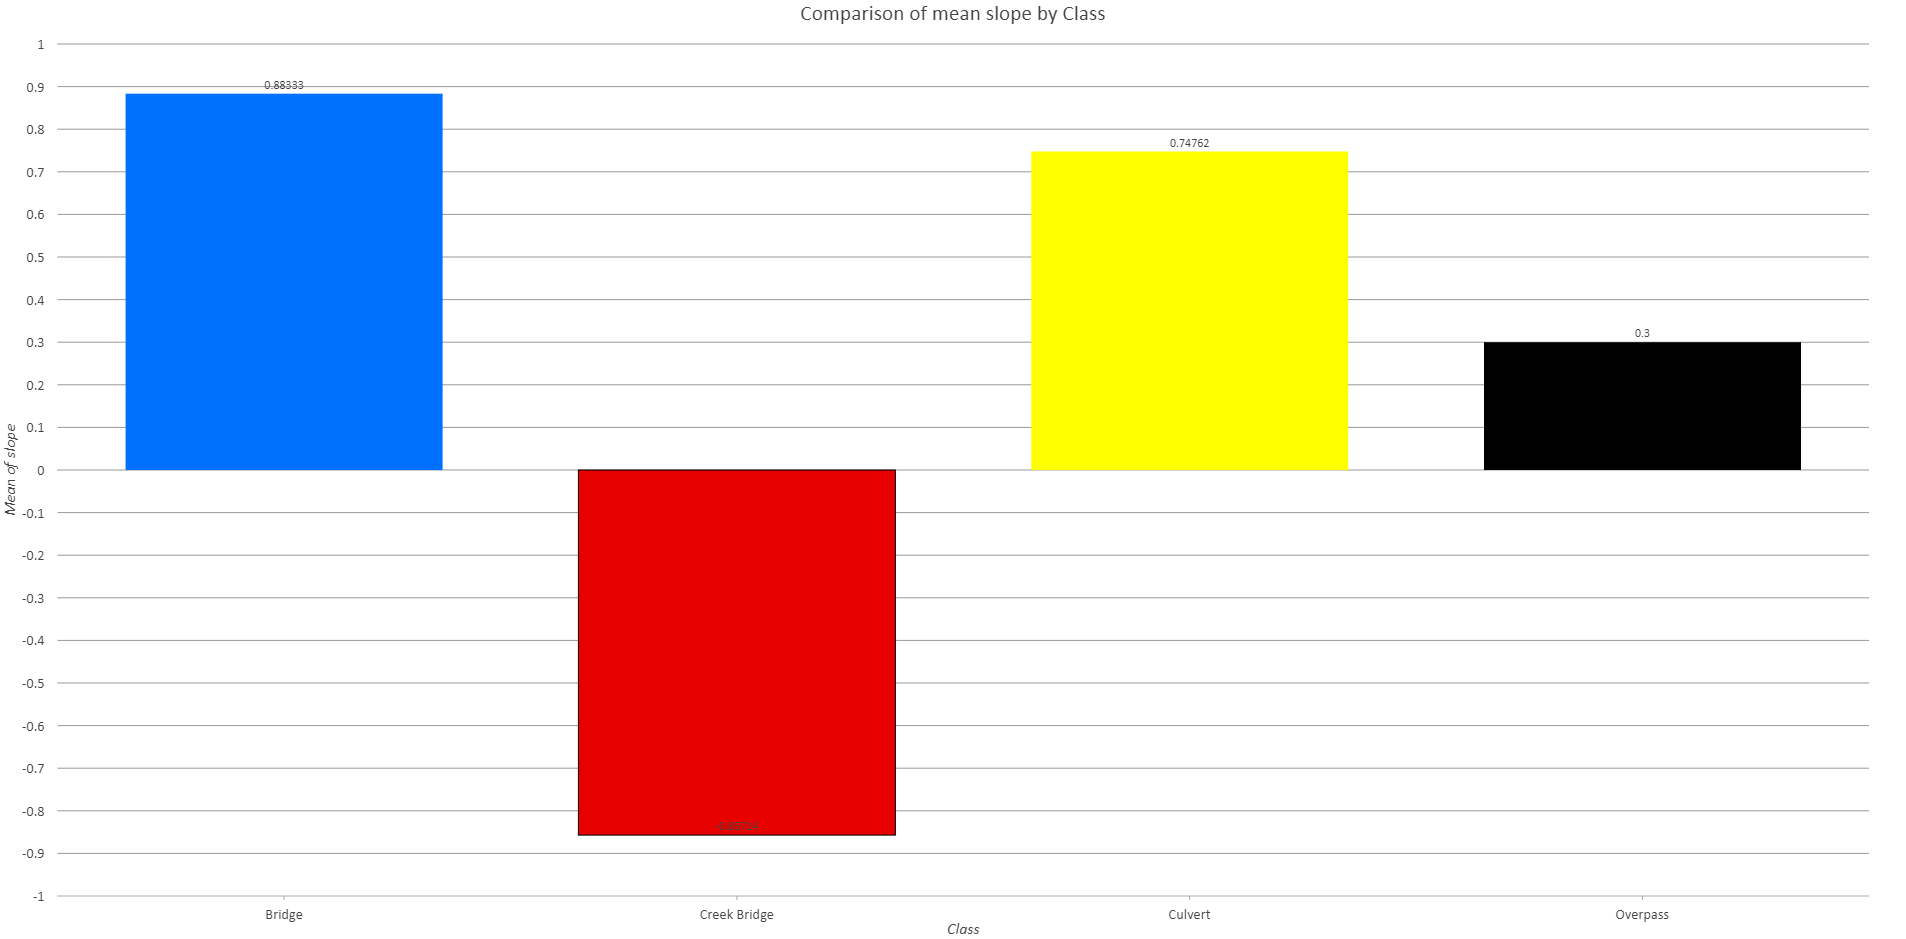
In order to find the range of acceptable slopes where crossings could be built we decided to analyze the attributes of the Banff wildlife crossings. After plotting the locations of the crossings in Google Earth we use the “Add Path” tool to create a line along highway 1. We then use the elevation profile to find the slope at each crossing location. We compiled the slopes into a table and sorted them by crossing type. We then took the mean of slopes for each infrastructure type, the highest mean slope was -0.85%. We also took the range of slopes for all crossing types. The steepest slope was 7.6% so we determined slope values for our proposed locations should be between 0% and 8% but that lower slopes should be preferred.
Choosing Crowsnest Highway
To choose a location for our analysis we used wanted to know where there were lots of collisions. To do this we first prepared the data by compiling the excel files for collisions from each year (2016-2019) and then using the “Display XY Data” tool to plot each collisions as a point on the map and then we projected the points to “NAD 1983 10TM AEP Forest”. We then used the “Snap” tool to snap collision points to roads with a 75m search distance. We then used the “Kernel Density” tool and created a 25m resolution raster, the same resolution as our other raster data sets. We then mapped various shapefiles that indicated important environmental areas and looked for locations with high collision density and high environmental importance.
Finding Suitable Crossing Locations
Our first step before conducting any suitability analysis was to project the DEM and the land use raster to “NAD 1983 10TM AEP Forest”, the projected coordinate system used for environmental analysis in Alberta. We then created a 1 km buffer around the road network, using the “Buffer” tool. Since we chose the section of Crowsnest Highway that passes through the Rocky Mountains, we clipped the road and the buffer to the edge of the mountain range. Finally we clipped the DEM, wildlife collision points, which we had prepared previously, and the land use raster to the road buffer.
Our final steps before the suitability analysis involved preparing slope data, collision density, and determining weights. Using the “Slope” tool, we used the planar method to convert the DEM to a slope raster. Using the “Point Density” tool we created a 25m resolution density raster of the wildlife collisions. We used an analytic hierarchy process calculator to obtain following weights for the criteria, 57% slope, 30% collision density, and 13% land use.
To conduct the suitability analysis, we used the “Suitability Modeler” tool. To rescale the slope raster we used the MS Small transform function with standard deviation and mean multiplier values of 1, a lower threshold of 0, and an upper threshold of 8. To rescale the collision density we used the MS Large transform function with standard deviation and mean multiplier values of 1, a lower threshold of 0, and an upper threshold of 0.18 (the maximum density of collisions). To rescale the land use classification we used the unique categories transform function. For completely unsuitable locations such as water or industrial land use we gave them suitability scores of -40 to ensure they wouldn’t be selected. Other land uses were given suitability scores we deemed appropriate for the land use type, for example mixed forest had a score of 10.
Finally we set our “Locate” parameters to have a total area of 3.4 km². We chose to find 10 regions with minimum areas of 50 m². The region shape was kept as a circle but the shape/trade off utility was set to 10% since the shape isn’t very important. We then created a 100m buffer around Crowsnest Highway and used the “Select Layer by Location” tool to find the areas where suitable locations intersected with the highway. The areas of intersection were our proposed wildlife crossing locations.
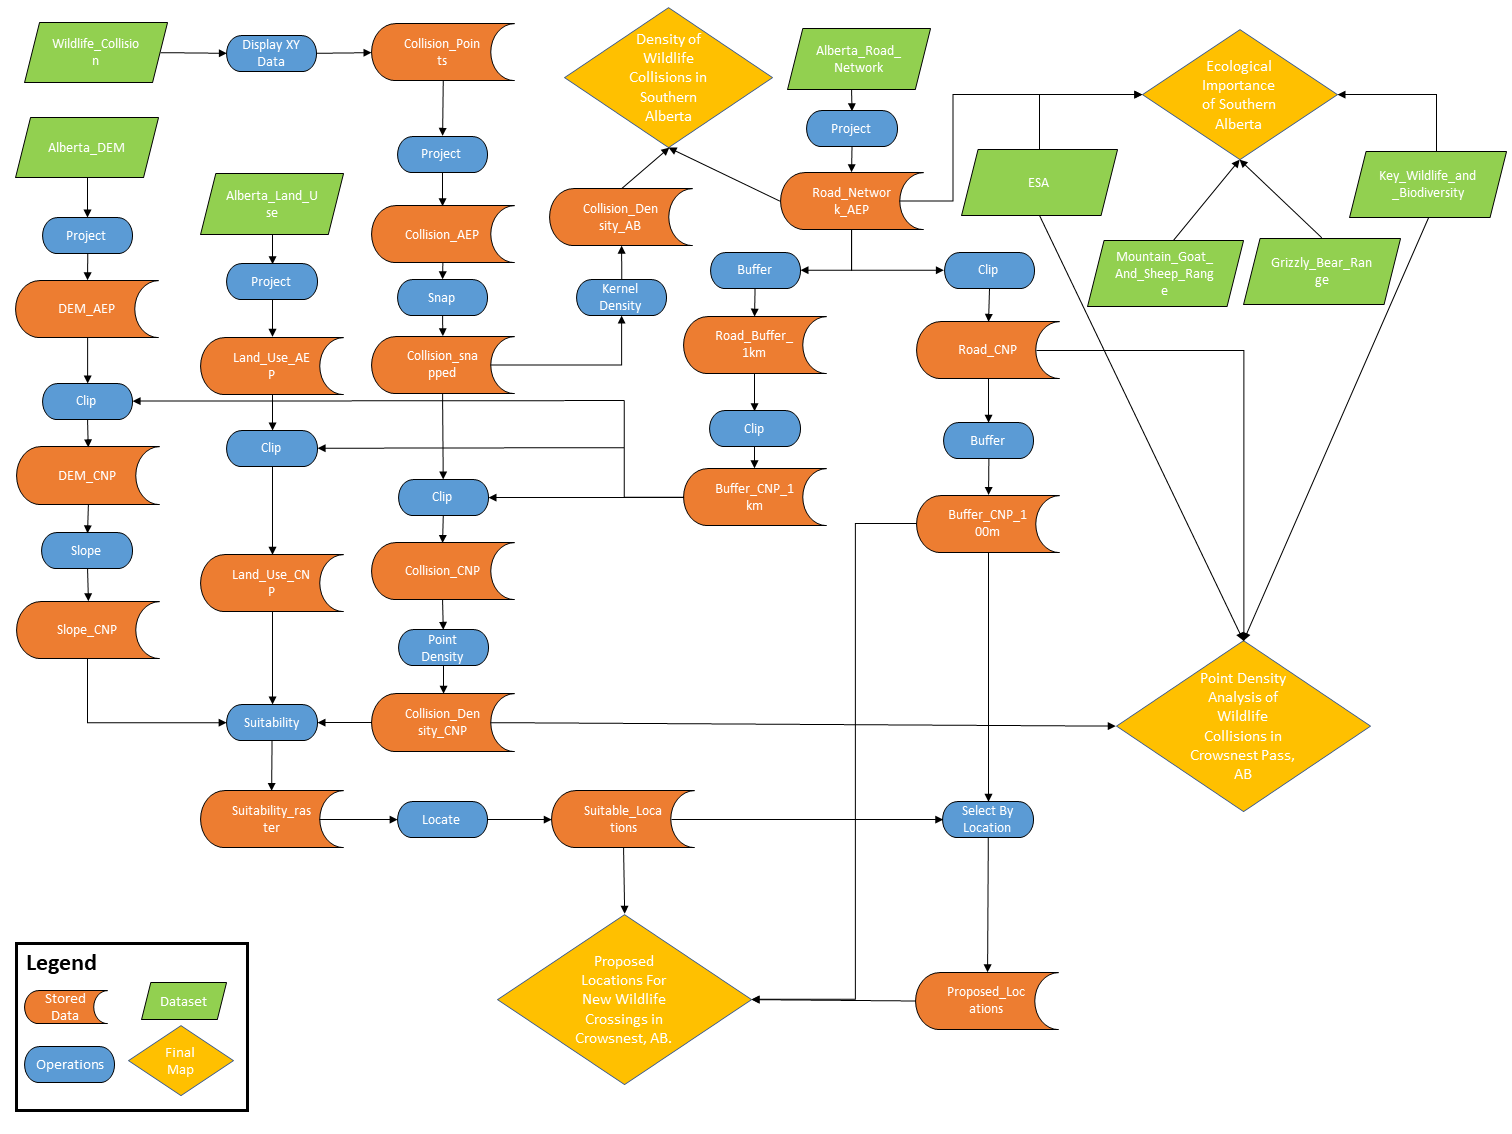
Flowchart