In this lab, I learned how to create a Housing Affordability Map to compare Vancouver and Ottawa.
Quantitative Data Classification

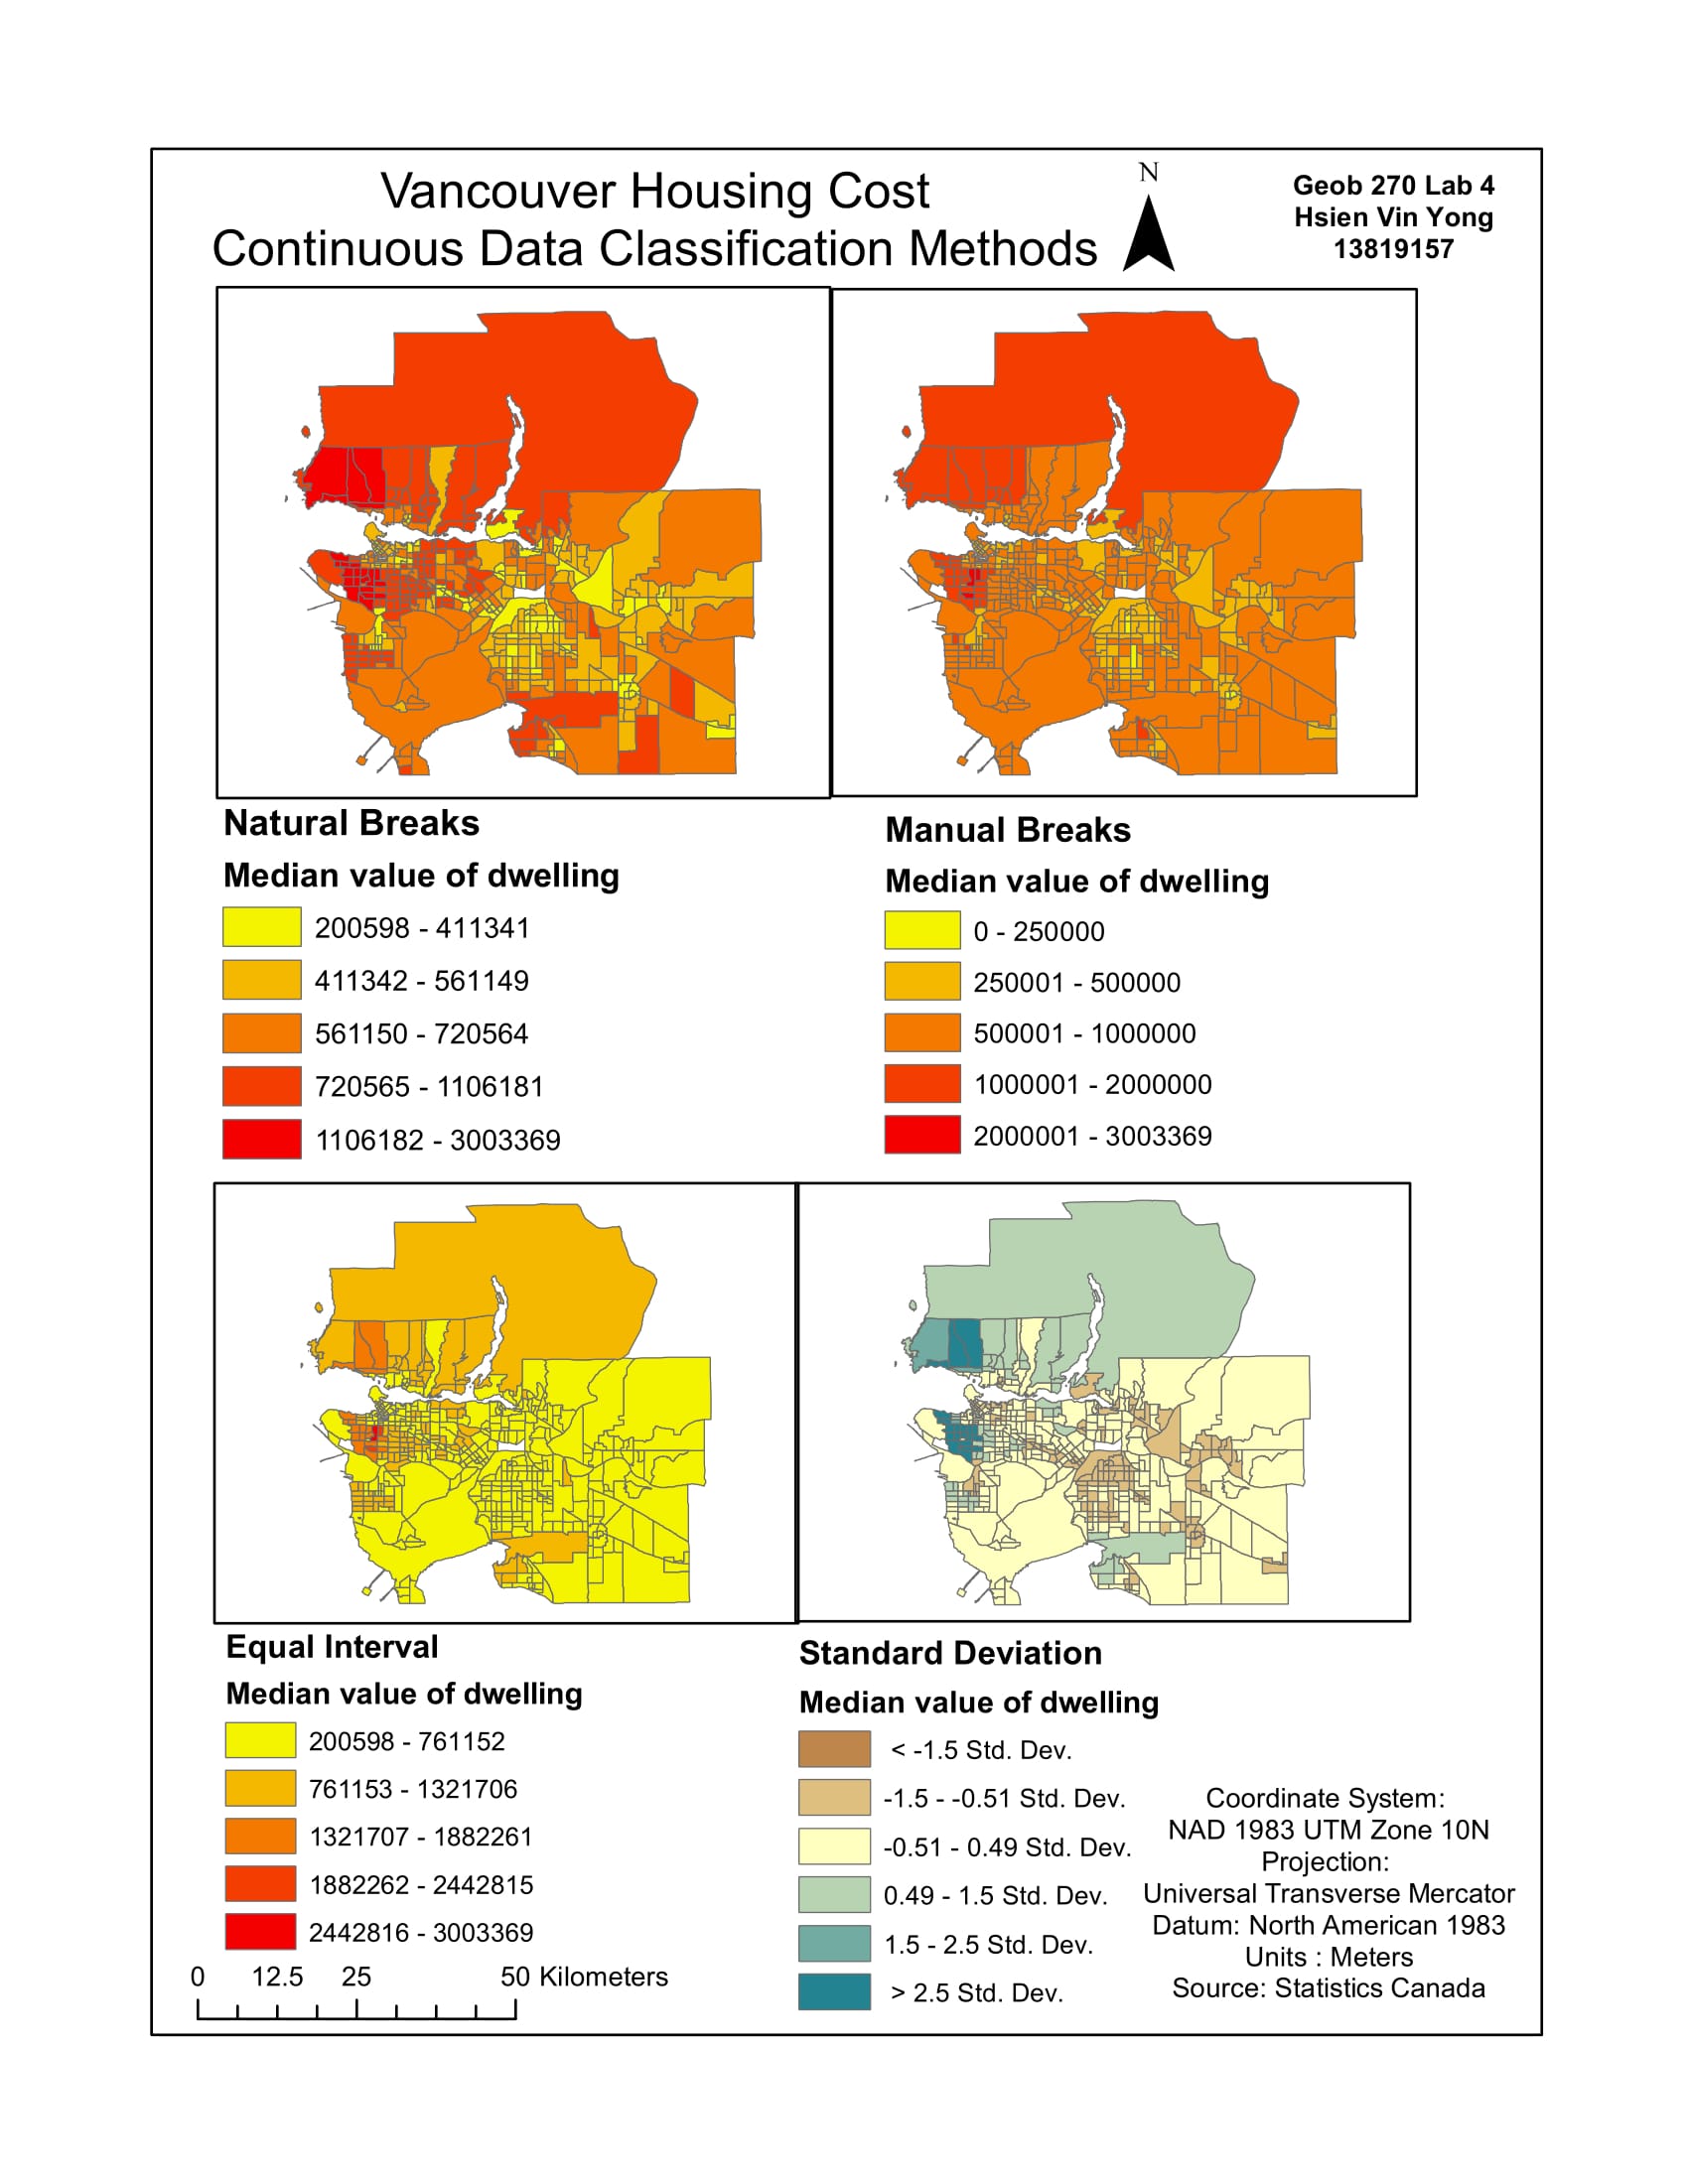
Vancouver Housing Cost: Continuous Data Classification Methods
Here I was given a question on which classification method would I choose and why if I were a Journalist or a Real Estate agent. As a Journalist, I would choose Manual Breaks classification method because it helps visualize which areas are the most and least expensive in terms of cost classification or break values that are round, even and is easily understandable by the general audience. As a real estate agent, I would choose the equal interval classification method because it helps visualize that the cost of housing is even across Vancouver with only a few dark tracts. Which helps prospective home buyers think that they are getting a good deal especially in the UBC neighborhood as it is known for its good location and reputation. The ethical implications is that any group or individual can use any classification method that showcases to their audience on what they want them to see in a way that suit their motives. In the case of the real estate agent, the buyer does not visually see how much UBC properties deviate from the standard, as these properties are more expensive than most of Vancouver.
Housing Affordability

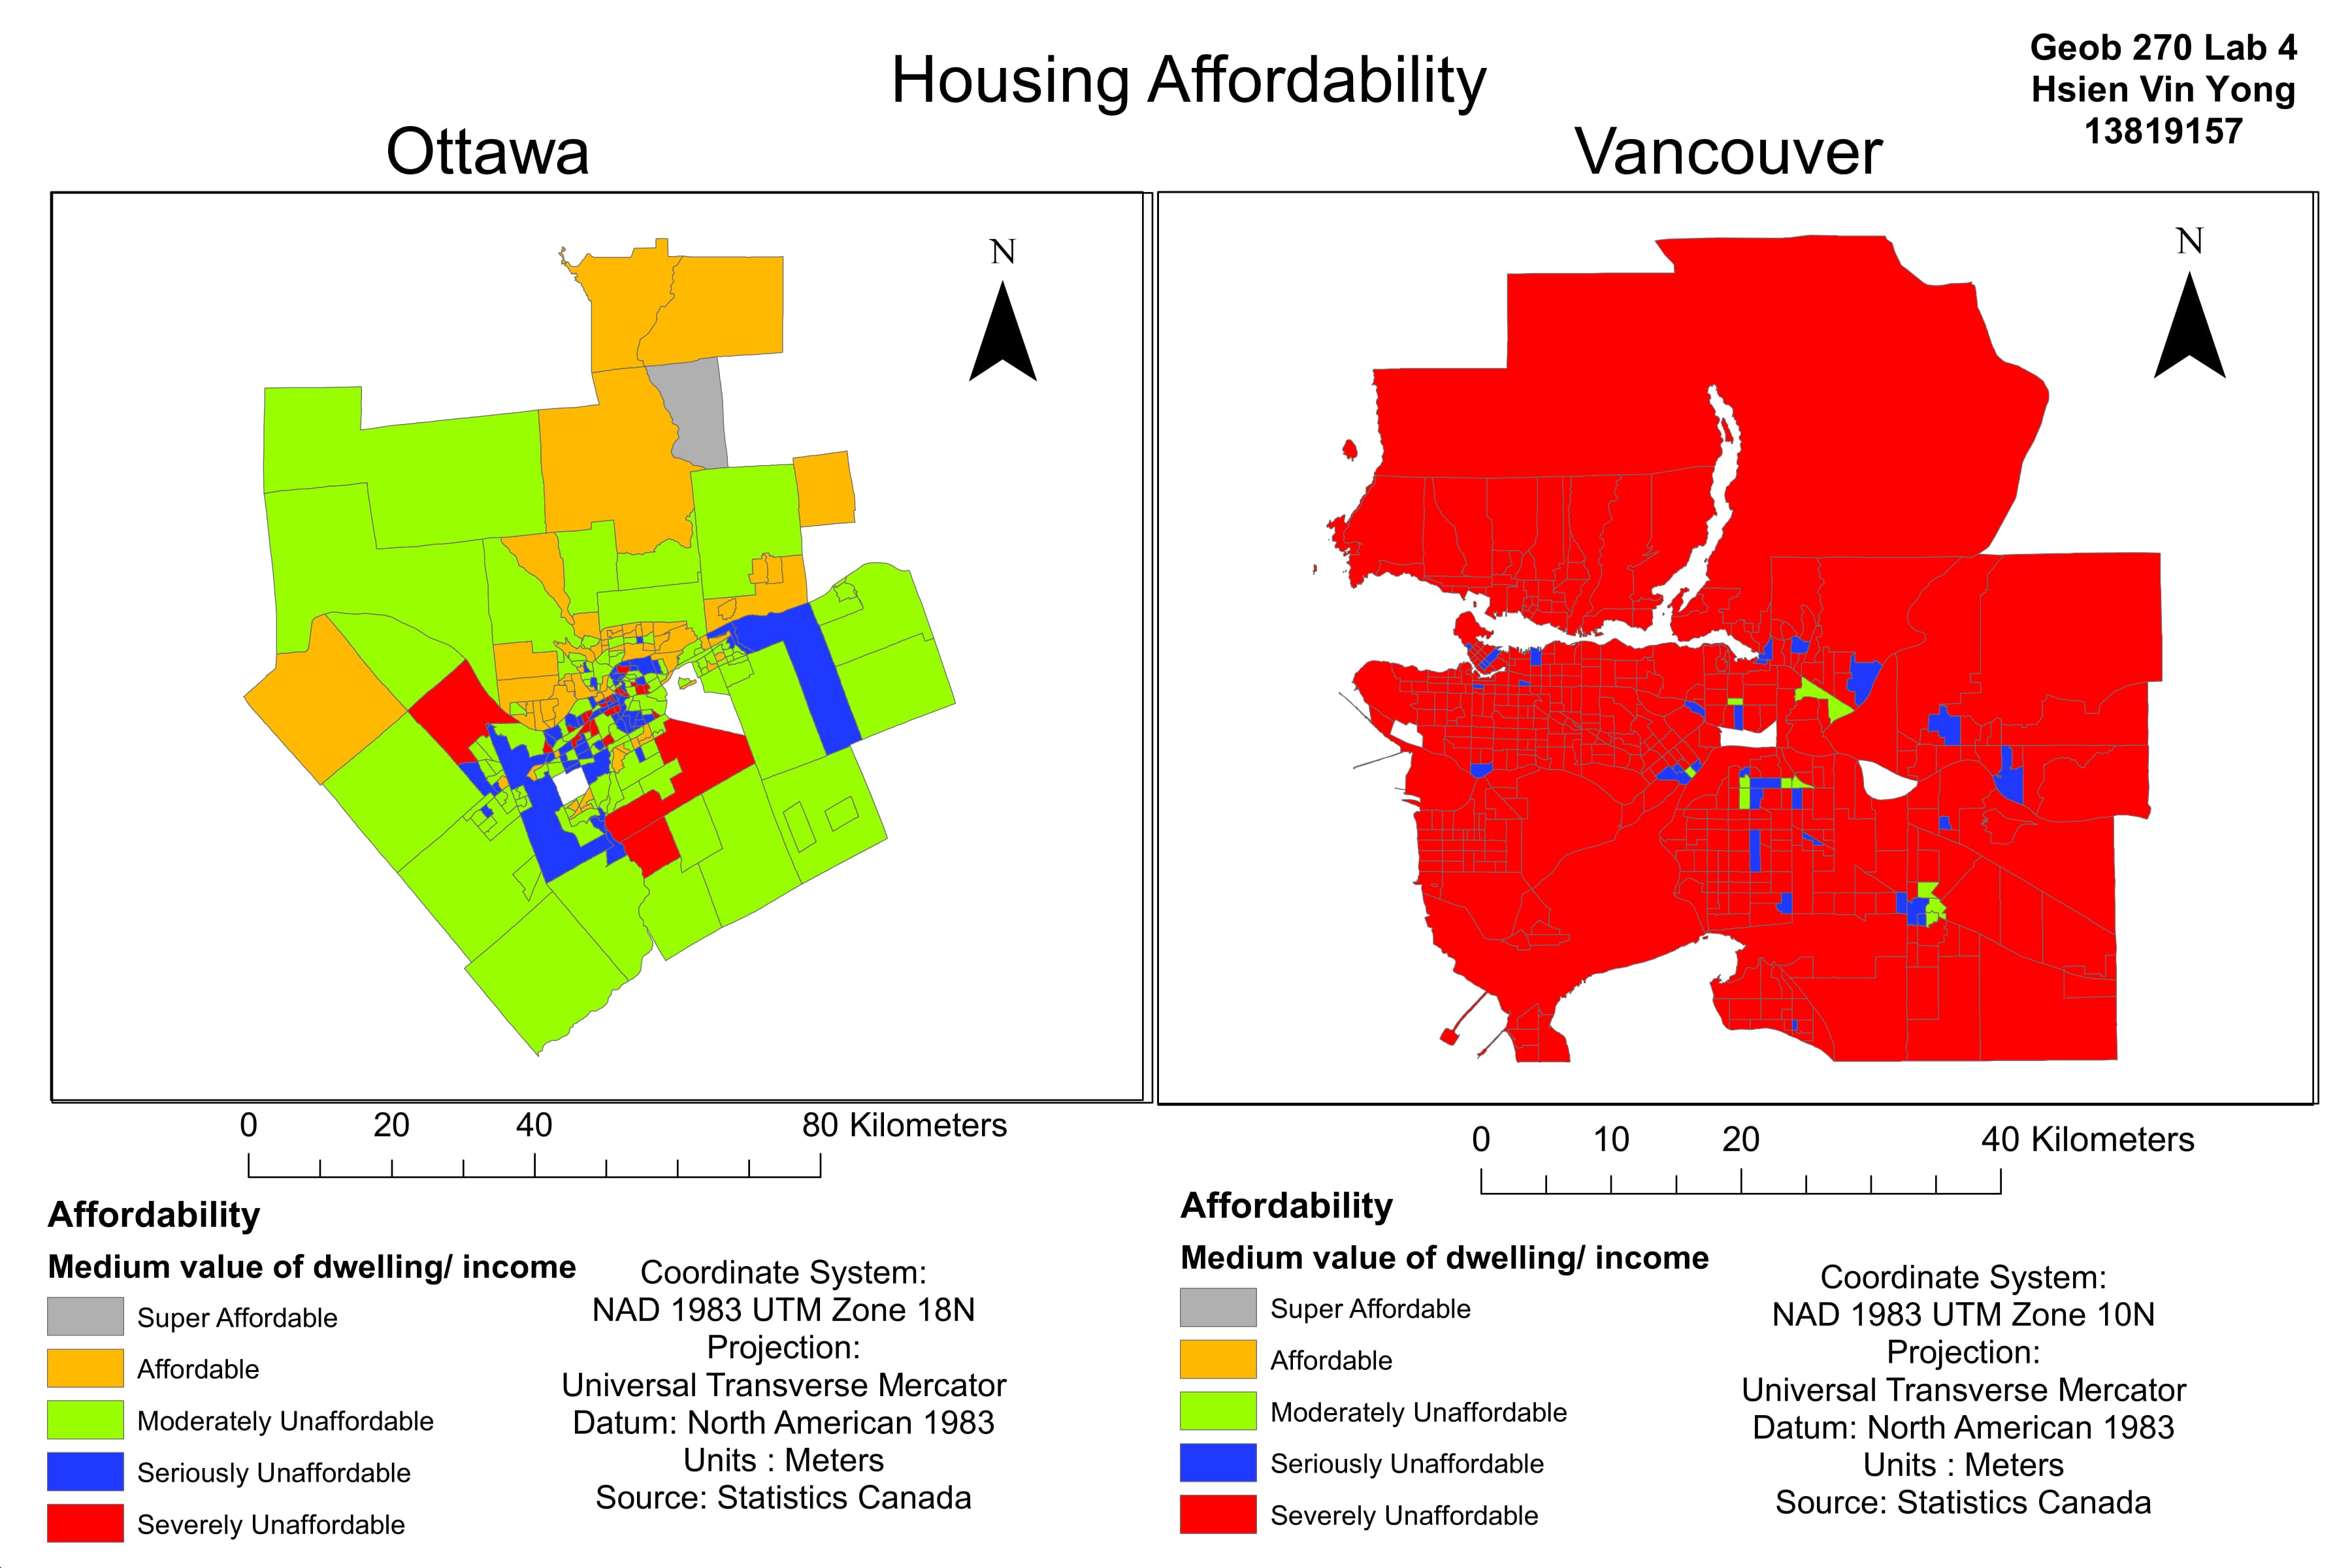
Housing Affordability: Ottawa and Vancouver
Affordability measures the ratio of median income to housing costs, which is a better indicator of housing affordability than housing cost alone because it factors into account the ability of the buyer to purchase a home of a certain with their given income.
The 11th Annual Demographia International Housing Affordability Survey determined the following housing affordability ratings as: 3.0 and under as Affordable, 3.1 to 4.0 as Moderately Unaffordable, 4.1 to 5.0 as Seriously Unaffordable and 5.1 & over as Severely Unaffordable. The purpose of this ratings is to monitor the rates of affordability and to alert policy makers regarding the decreasing of affordability in cities. This rating system can be trusted as it covers 378 metropolitan markets in nine countries and it is recommended by the United Nations and major World Banks for assessing affordability.
Affordability is not a good indicator of a city’s livability because it does not factor in employment availability, poverty rates, and access to quality healthcare and education. In order to determine the livability of a city, these factors as well as others must be included with housing affordability so proper livability assessment can be made.