A Network of Texts
In week 6, when we discussed the breakout of the visual, one of the comments I made was that my grade 6 students really struggled this year when interpreting graphs and visuals. This assignment allowed me to step into their shoes because woah.. this graph?! Let’s just say the world of data is not one I am familiar with analyzing.
The responses and groupings of similar responses are only similar because they were selected through the quiz. Though the reasons for selection may have been similar too, these reasons are not at all reflected in the visualization. John and Akshaya (Code.org, 2017) discuss in their video about search, that every click adds strength or weight to the nodes of search engines. To the search engine, these clicks carry importance but not necessarily justification. It is easy to click your way into a rabbit hole, however this network of clicks doesn’t always mean you’ve found what you’re searching for. In the same sense, though the visualization of song selections is neat, the only “reasoning” it provides is that for SOME reason, we decided on the same track to be selected.
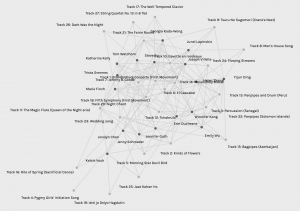
To some extent the tracks that were not selected or were selected less frequently are represented in the visualization. Nodes that have less edges indicate that they were not selected as many times. For example, we can see that track 4 appears to only have one edge while track 12 looks to have about 8 edges. Though this indicates the amount of times a track was or was not selected and in turn how much weight it has, there is still no reasoning behind it. The data here is very quantitative, as is the perhaps the search engines that we use everyday.
References:
Code.org. (2017, June 13). The Internet: How Search Works (video file). Retrieved from https://youtu.be/LVV_93mBfSU
Hi Zoe,
I have seen a few people mentioning how track 4 was only chosen once, but I remember doing my data analysis and wiring about how every song was chosen more than once. I went back to look at the data I reviewed and it looks different than yours. I don’t think I can attach a screen shot on here but when I look at the data, track 4 has five branches going off of it, so I wonder if we have the same data set or not.
Hey Erin,
That’s really interesting and strange! I was also unable to see my own name anywhere within the data so perhaps I was viewing it incorrectly somehow?