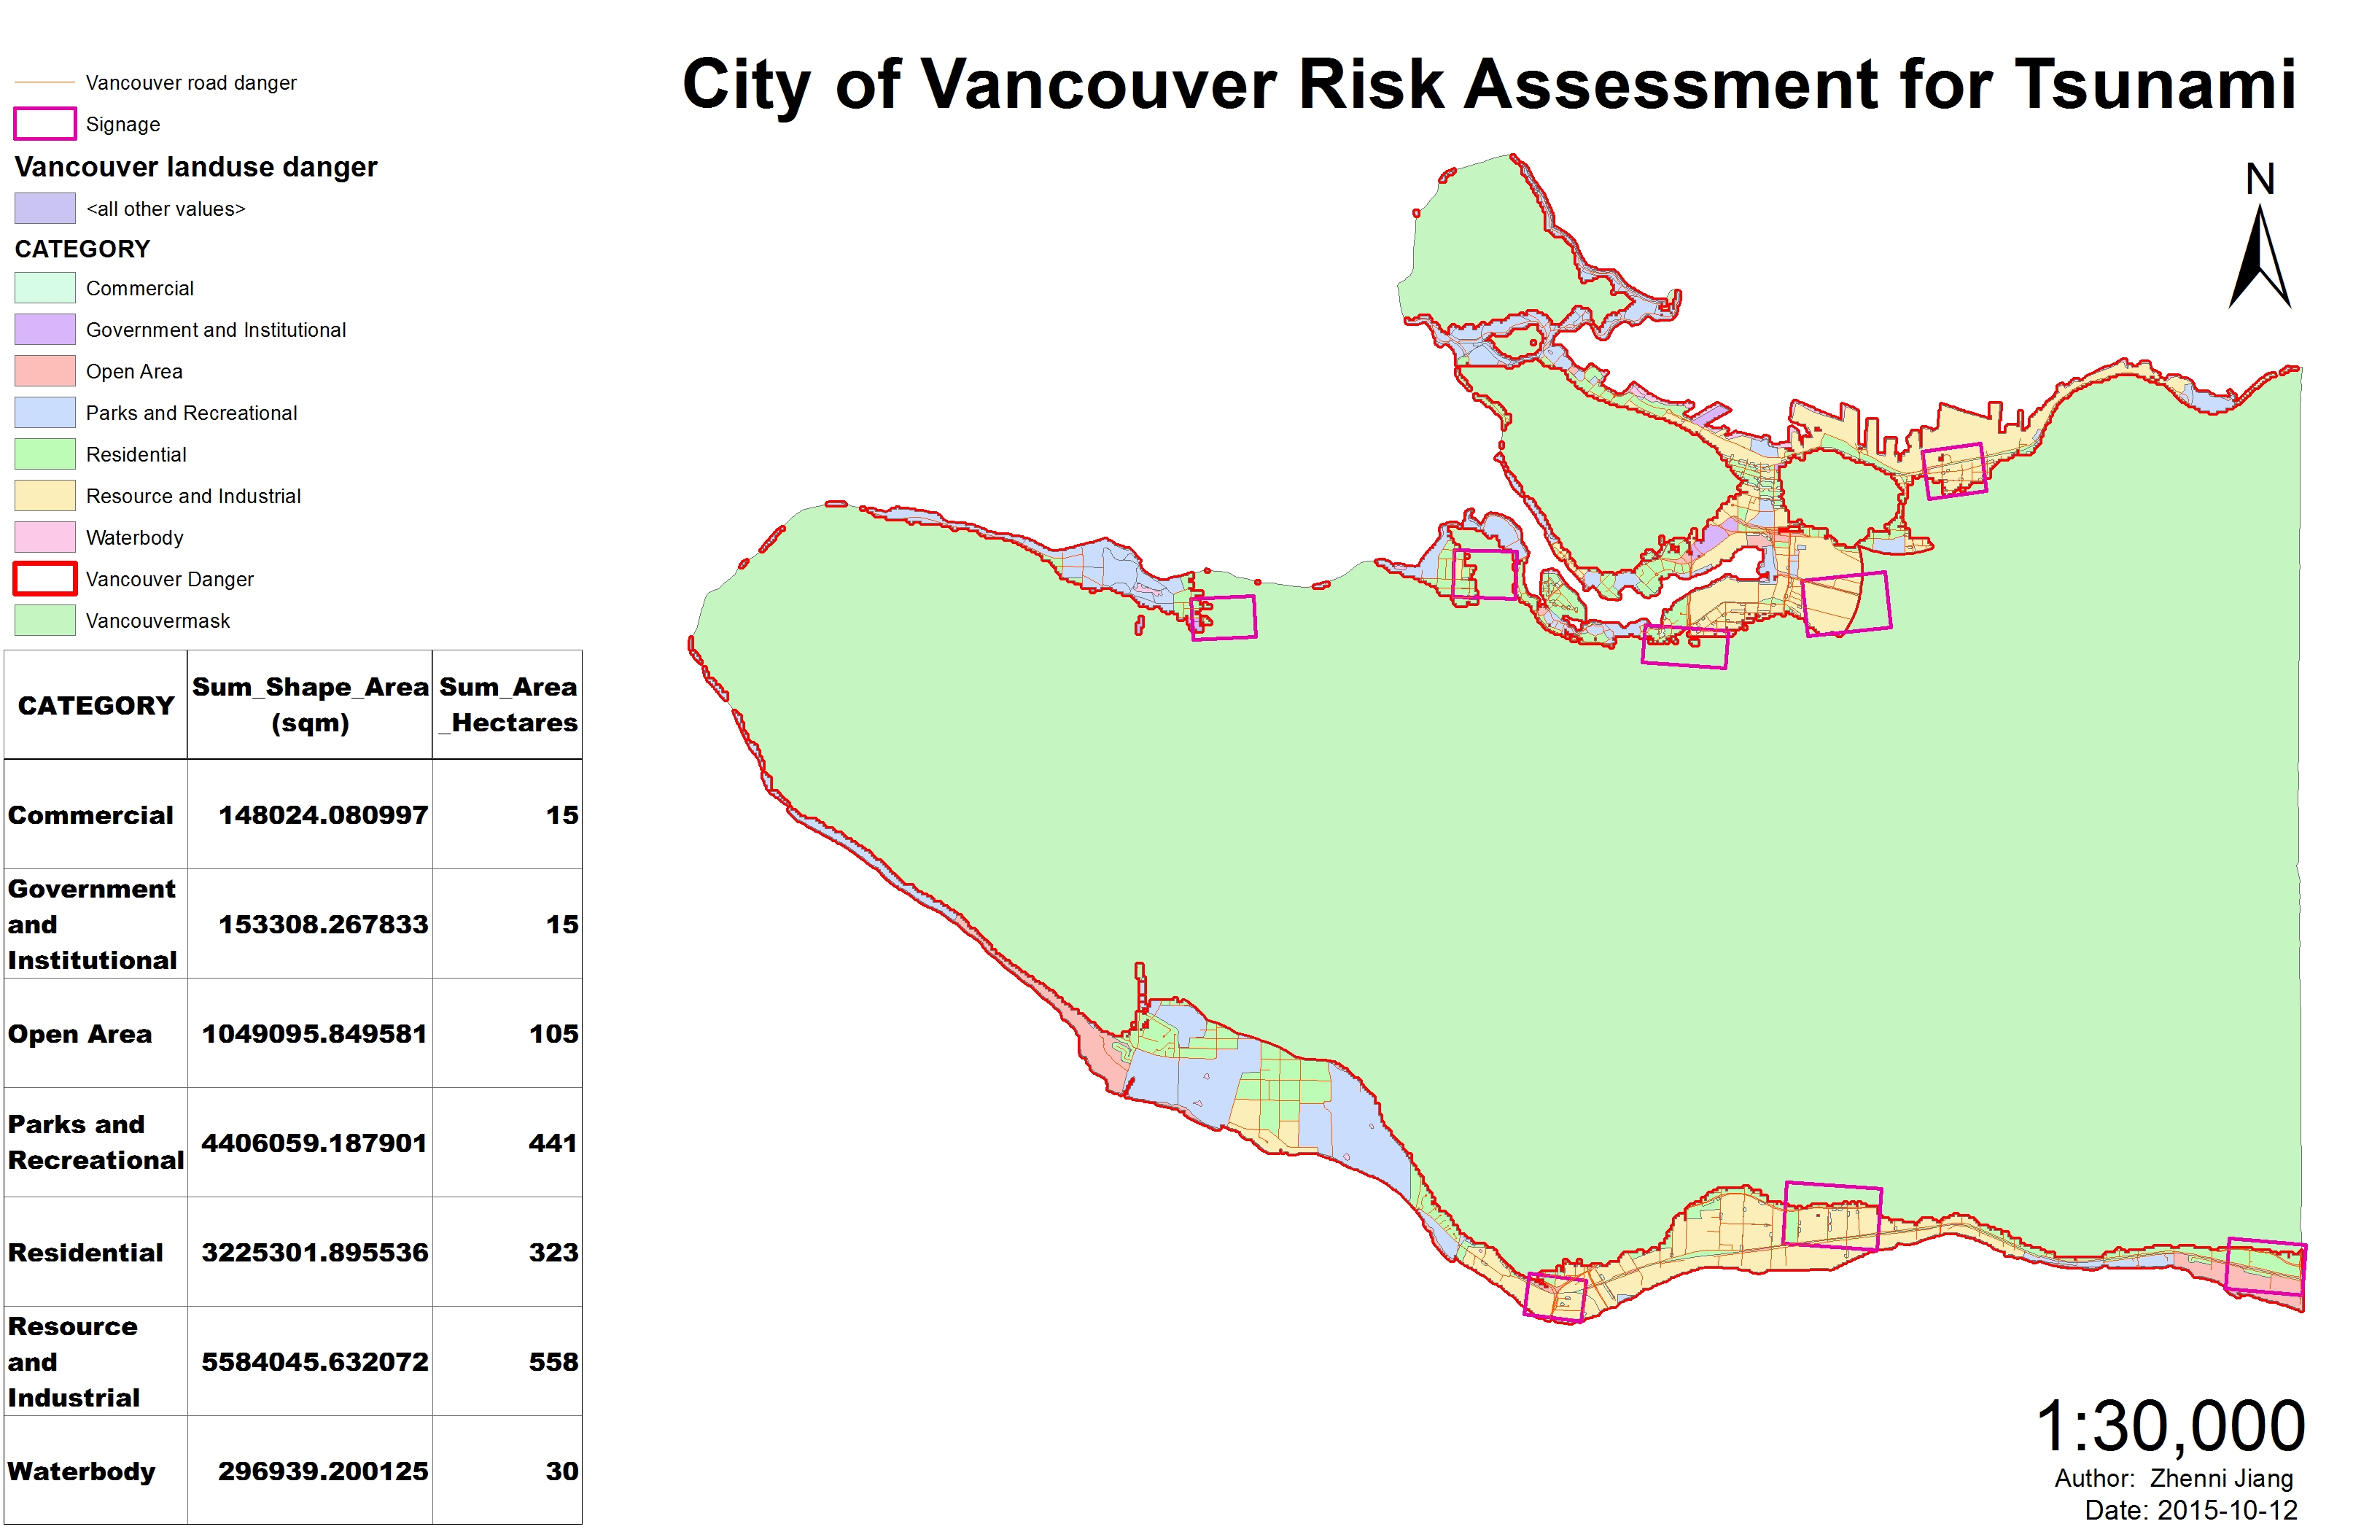
Around 11.35% of the City of Vancouver’s total area is in danger. Because the total area in Vancouver in danger is 14875501.704403 m2
- Right click on the Vancouver_Danger layer, and click on the open attribute table>>find the area column>>right click on it and select statistic>>you would see the number of sum of area
The total area of Vancouver is 131033339.950334m2
- Similarly, open the attribute table of Vancouvermask, and there’s only one data for area, and that’s the total area.
Therefore the percentage of affected area in Vancouver will be 14875501.704403/131033339.950334*100%≈11.35%.
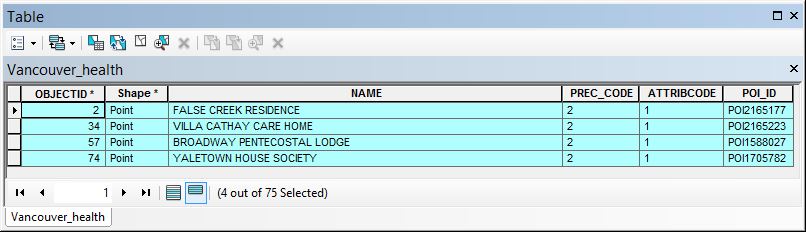
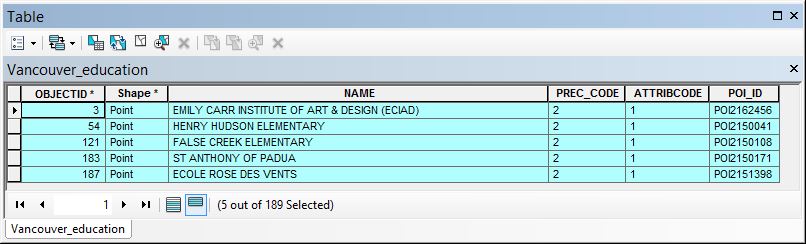
The two tables below are the lists of facilities that constitute the layer of healthcare and educational facilities within City of Vancouver danger zone.
 Steps:
o Under the Selection menu options, choose Select By Location
o In the Selection method, choose select features from
o In the Target layer(s): check Vancouver_health & Vancouver_education
o In the Source layer: choose Vancouver_Danger
o In the Spatial selection method for target layer feature(s) choose Intersect the source layer feature
o OK
o Check Vancouver_health & Vancouver_education under TOC, so that we can see the highlights of those selected facilities.
o Open the attribute table of Vancouver_health & Vancouver_education, at the bottom, it says the number have been selected.
o Next to the number, there’s a bottom called “Show selected records”, click on it. And we can see all those list of selected data.
 Follow