
-Example of Dwelling Cost of the City of Vancouver CTs
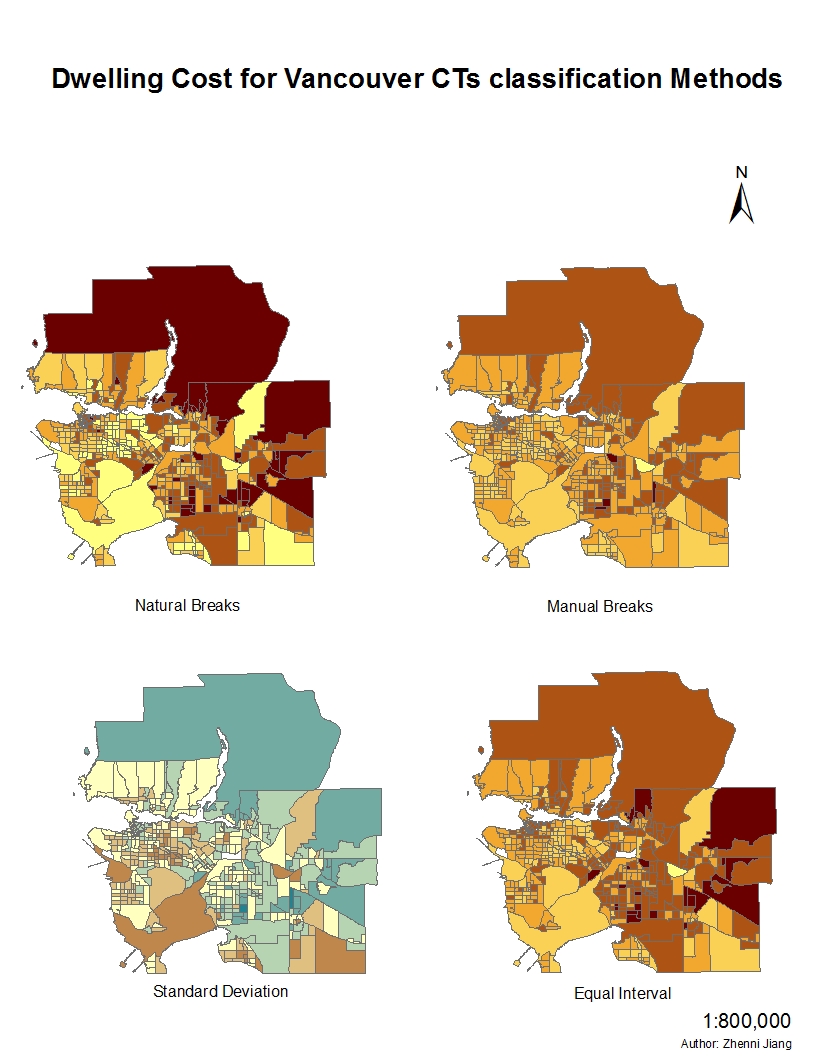
In the City of Vancouver, housing prices are rising continuously. However, how to rational invest on housing decides dwelling expenses. Therefore, to give a clear view of the housing prices of the city, I used 4 classification methods-Natural Breaks, Manual Breaks, Standard Deviation, Equal Interval, and presented their differences through the map above.
The perspective of a journalist, and the perspective of a real estate agent, the option are different based on different standpoint and purposes.
- If I were a journalist, I would recommend Standard Deviation Classification method. Because this method can give audiences with different level of wealth a straightforward view of the highest, the lowest and standard housing cost in the city.
- If I were a real estate agent, I would choose Equal Interval Classification. As the map shows, Equal Interval Classification displays housing costs in the city of Vancouver are almost the same except for downtown area and east part. In this way, it means when housing price is similar, housing near UBC would be more beneficial in terms of accessibility to higher education compares to other areas in the city. As a real estate agent, the target is to make profits, so that this choice of classification method is beneficial to advertising and marketing methods. As the standard deviation map shows that there are more places in the City of Vancouver have much lower housing price, in this case, an equal transaction is hard to achieve. However, this method would persuade buyers to buy new properties more efficiently.
Therefore, we need to choose different classification methods up to different situations, and all classification methods have distinguished emphasises and representation which would influence decisions of audiences and recipients. Summarization of classification methods as follow:
- Natural Break Classification: differentiate various groups of features.
- Standard Deviation Classification: shows how the distribution of features varies from the mean value.
- Manual Break Classification: this method can be very useful for specific purposes if intervals are classified properly, vice versa.
- Equal Interval Classification: easy to compute and show classes evenly.
 Follow