Danger areas in Vancouver for Tsunami:
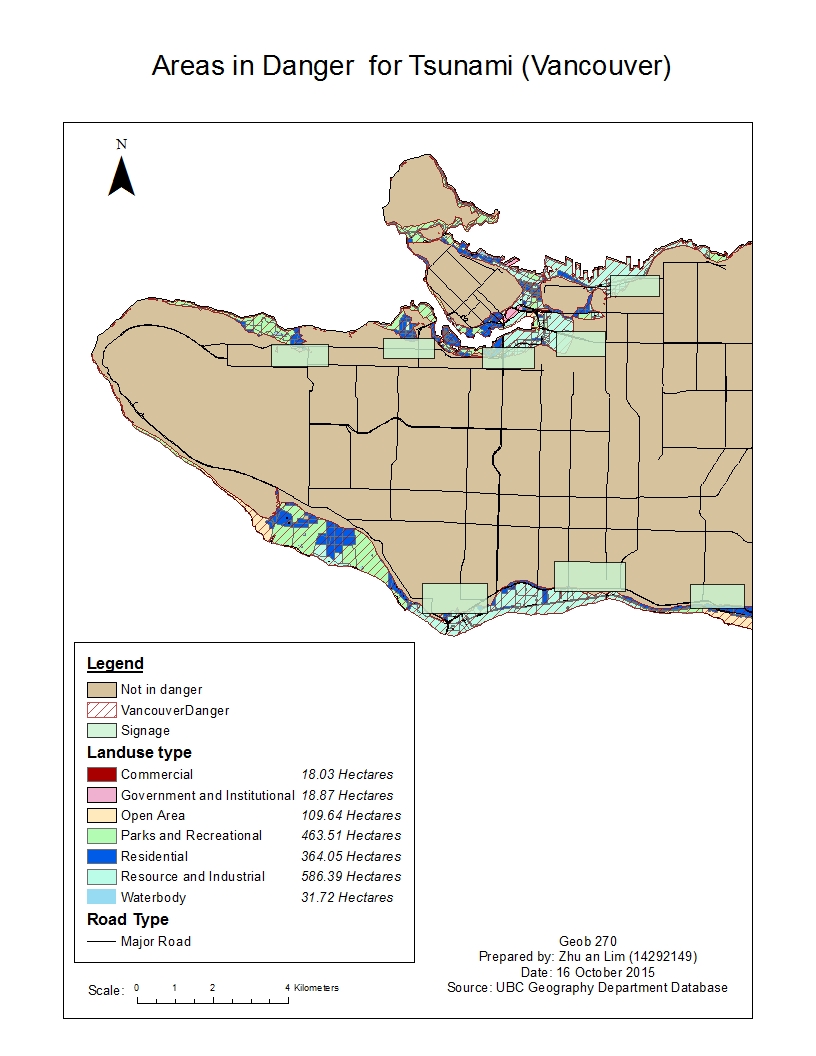
Using the both tabular and spatial data, i created a map to show the areas that are in potential danger in an event of a Tsunami. In order to do this, i used the overlay tool intersect in GIS to combine different layers of data to show the areas that are in danger.
Approximately 12.16% of Vancouver’s total area is in danger, which adds up to 1593.48 hectares. Using the attributes table for the layer of land use in danger, I am able to calculate the percentage of the total area that is in danger (for all land use types), by finding the ratio of the areas that are in danger to the total land area of the city. This can be done by summarizing the values for each land type according to the sum of their total area.
There are a couple of Healthcare and Education facilities that are within the danger zone. Education: Emily Carr Institute of Art & Design (ECIAD), Henry Hudson Elementry, False Creek Elementry, St Anthony of Padua, Ecole Rose Des Vents / Healthcare: False Creek Residence, Villa Cathy Care Home, and Yaletown House Society. To do this in GIS, I first select by location for the healthcare and education institutes that intersects with the danger zone layer. I then exported the data and created a new layer for the selected locations.