Skills and experiences with Geographic Information System/Science
GIS in geographical analysis:
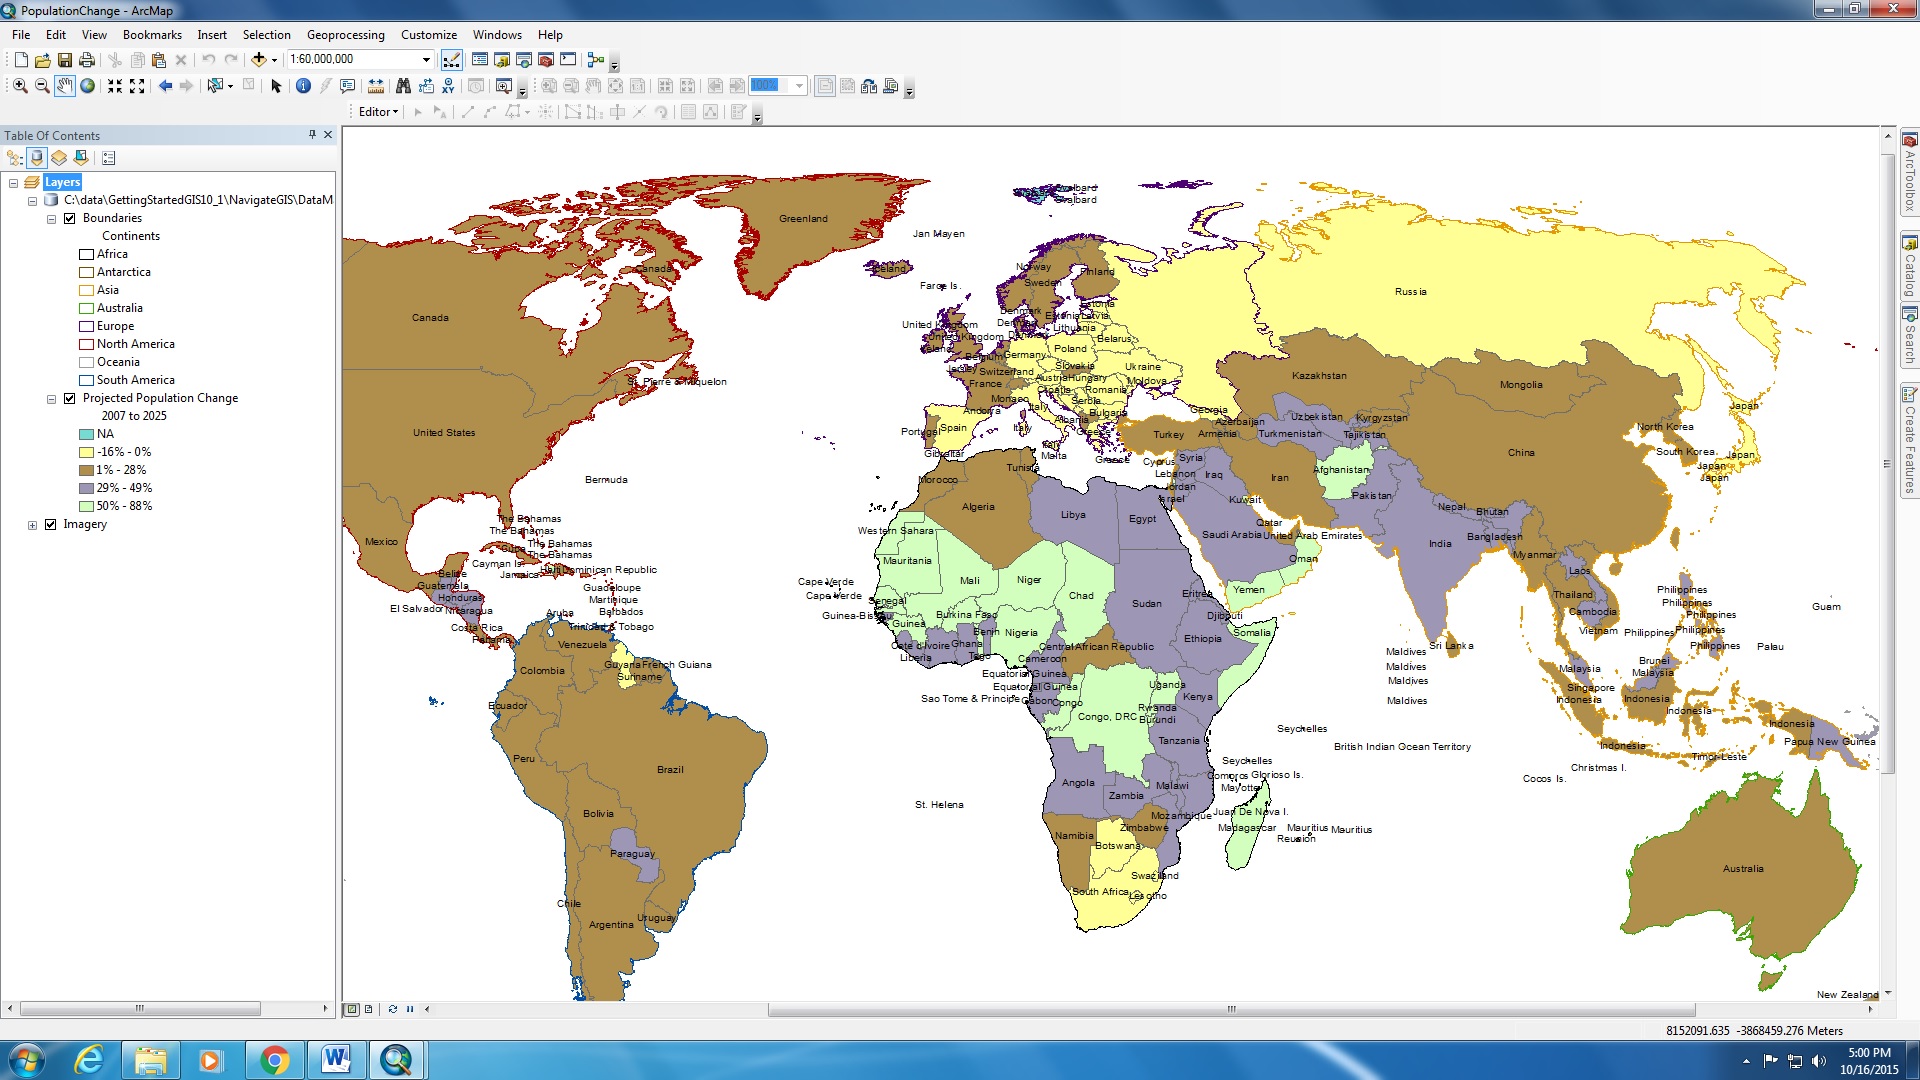
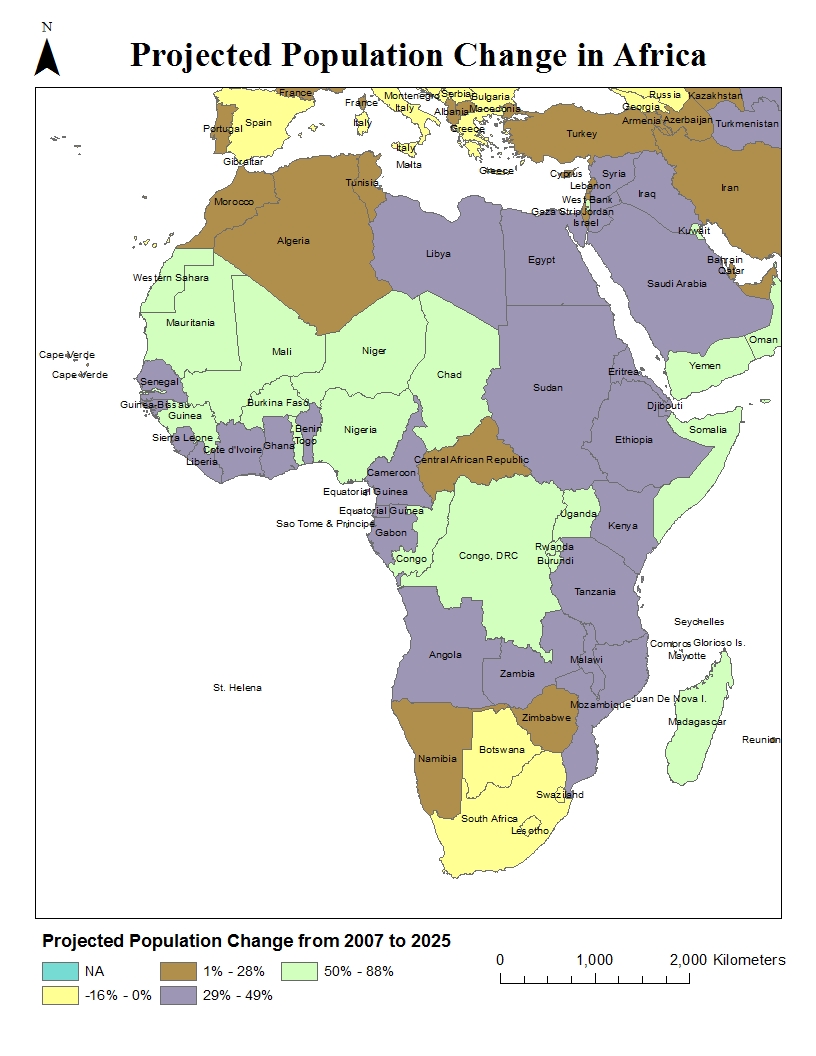
I have practical working knowledge of ArcGIS and i am able to utilize a variety of datasets in multiple contexts (e.g. population changes, environmental impact assessments, etc.) for geographic analysis. I also learned to use of a combination of spatial and tabular data, to construct maps that demonstrate trends and patterns in the data set. For example, in order to show the difference in population of different countries and continents in the world, i combined the shapefiles of different countries with a set of tabular data which records the population pertaining to individual nations. Because the spatial data and tabular data are encoded, the different polygons (land area) are presented by specific values (e.g. population, types of plants, etc.), and hence describe the patterns in the data. (See below for examples).
Using Raster and Remote Sensing data:
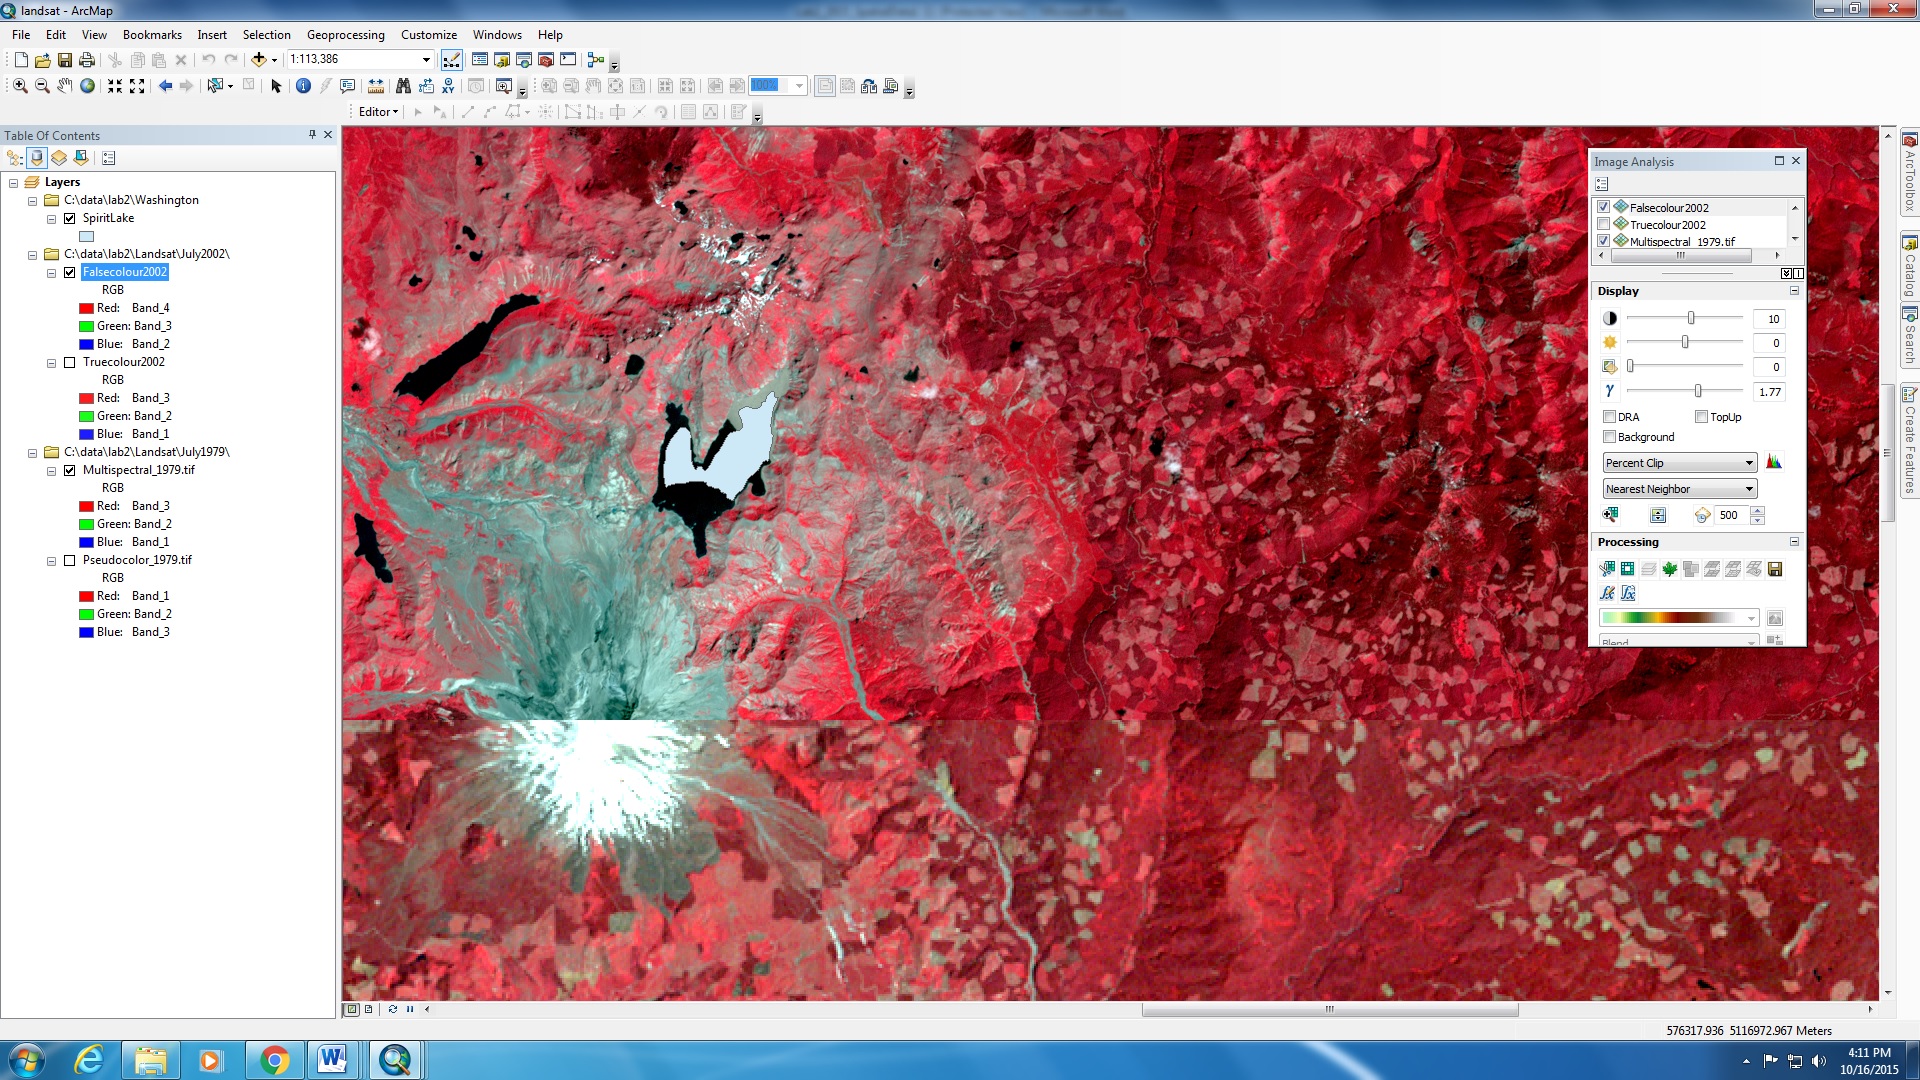
I used remote sensing data (Landsat) in a raster data form to analyse the impact of the eruption of Mount St Helens in 1980. Landsat data is a form of satellite data which measures in different wavelengths (e.g. Near Infrared Radiation), and GIS has the ability to present these data in different bands of colour. The image on the left is NIR, showing the vegetation in red. I used data for 1979 and 2002 to show the before and after effects of the eruption, by simply using the image analysis tool in ArcGIS.
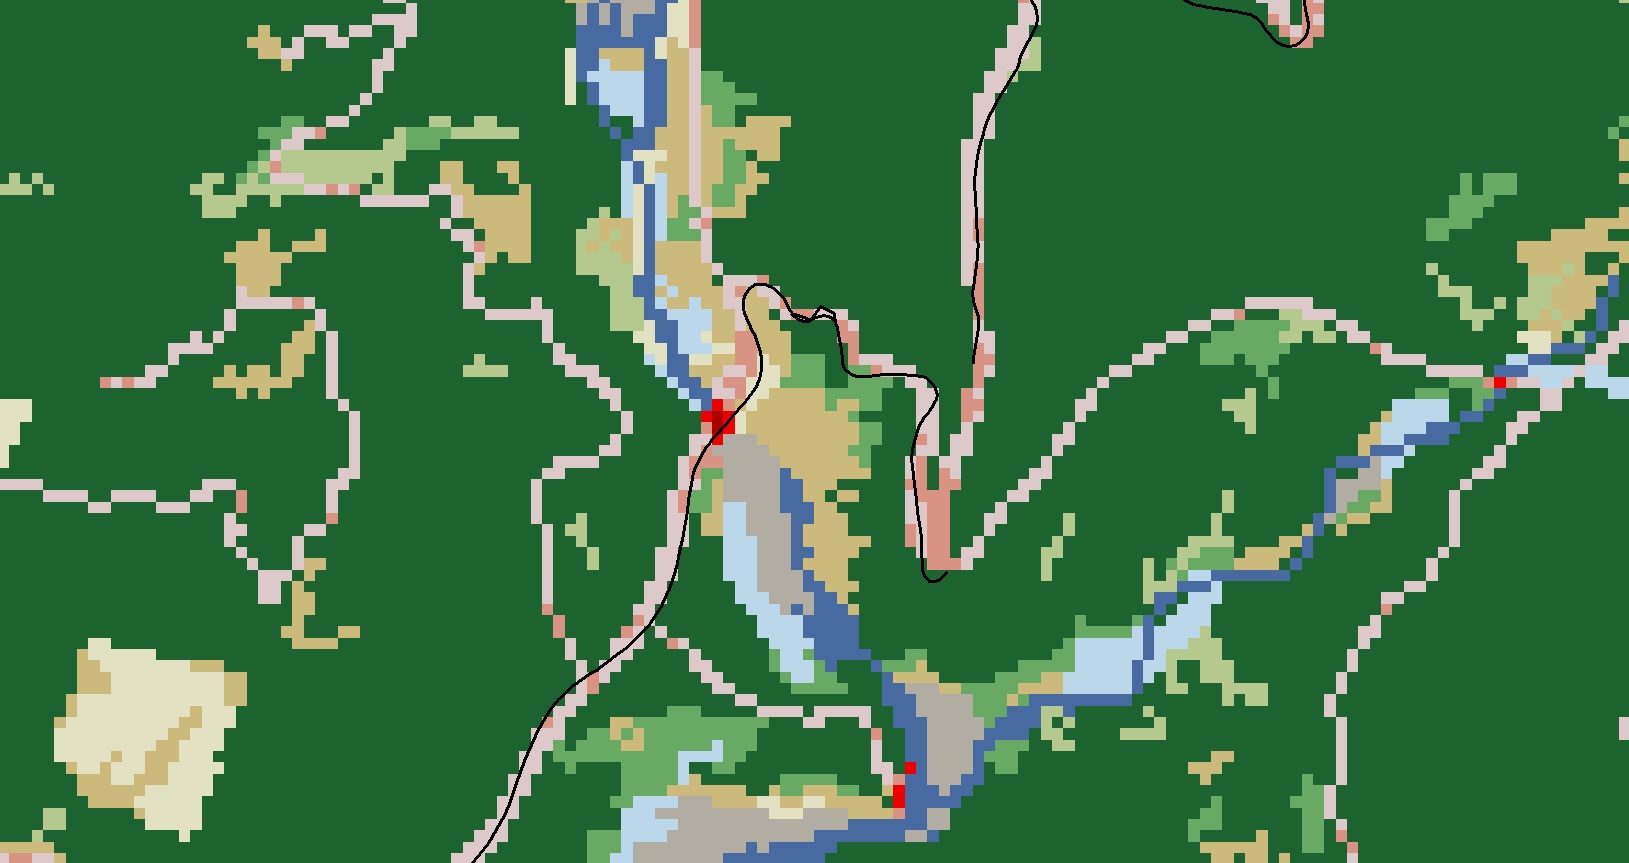
Used different layers of raster data and vector data and understood the difference between the two. Raster data are made up of pixels and each cell represents a value (e.g. area). Vector data on the other hand are made up of points, lines, and polygons. Notice the black line in the map on the left, that is a service road represented by a line. The raster layer uses a combination of cells to represent the same feature. There will be less precision in the raster layer since a cell will represent the majority of the feature in that cell.
Buffer proximity analysis and overlay tool:
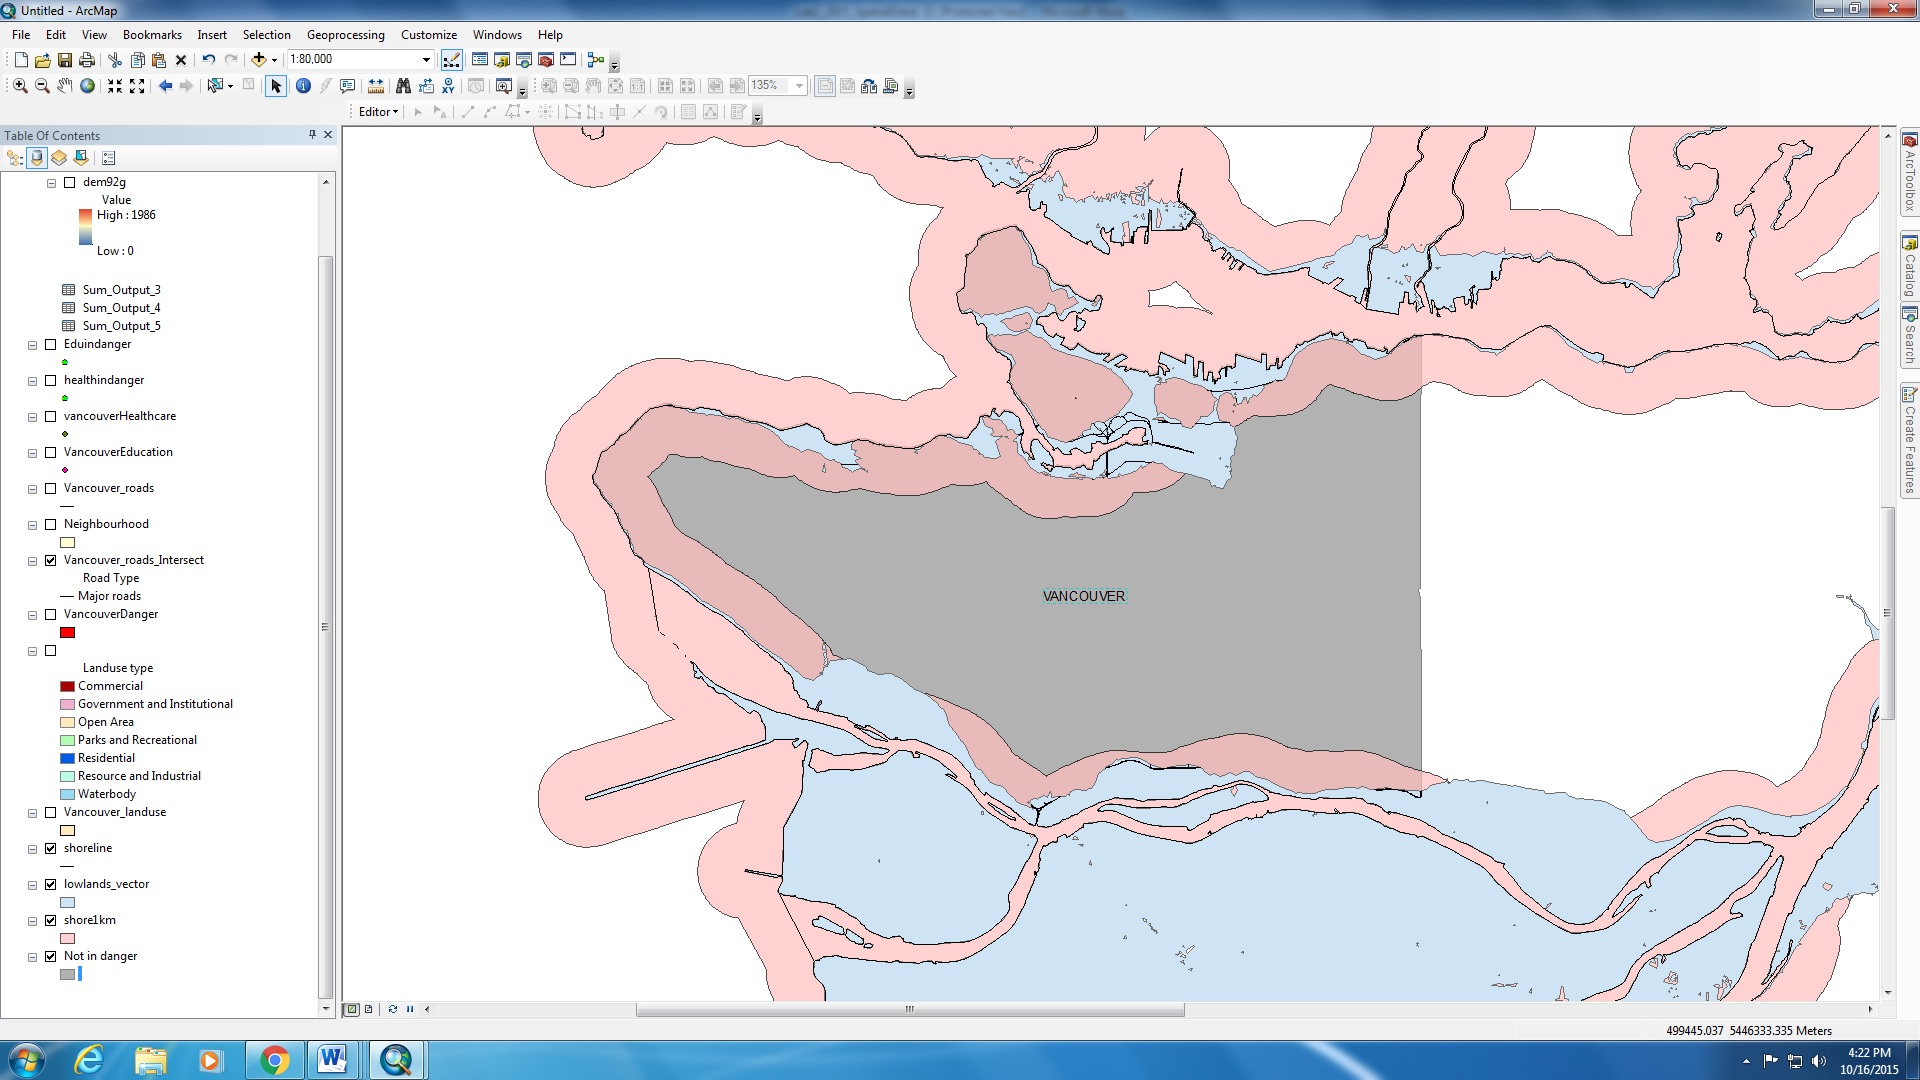
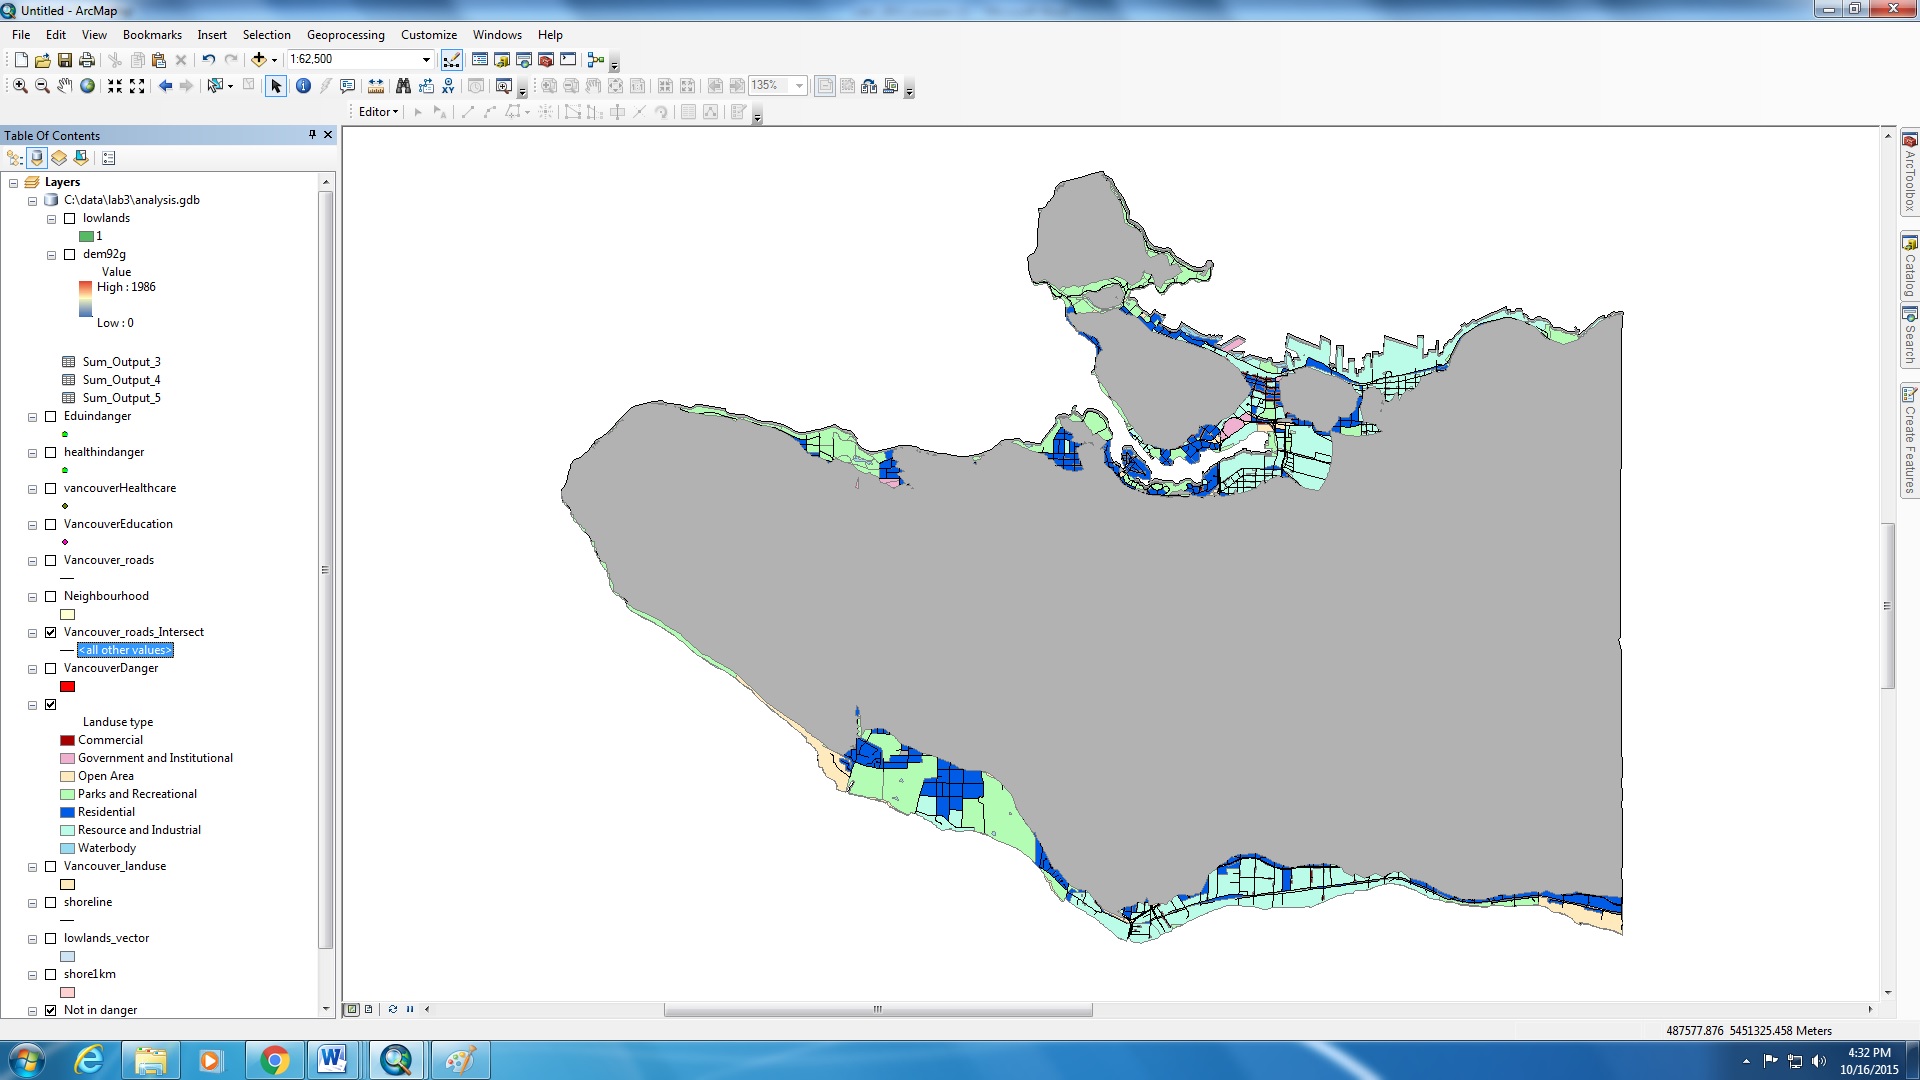 I am interested to find out the areas of Vancouver that are at risk from a Tsunami. In order to determine the areas that are 1 km from the shoreline (areas in pink on map), I used the buffer proximity tool from GIS analysis. I also used the overlay and intersect tool to create a new layer that shows the connection between the the low lands (land below 10 m) and the 1 km buffer proximity from the shorelines that i previously created. By overlaying the layers that have intersecting attributes, we can focus on the areas that are pertaining to the study. In this case i am looking at areas in Vancouver that are 1 km from the shoreline and below 10 m in elevation.
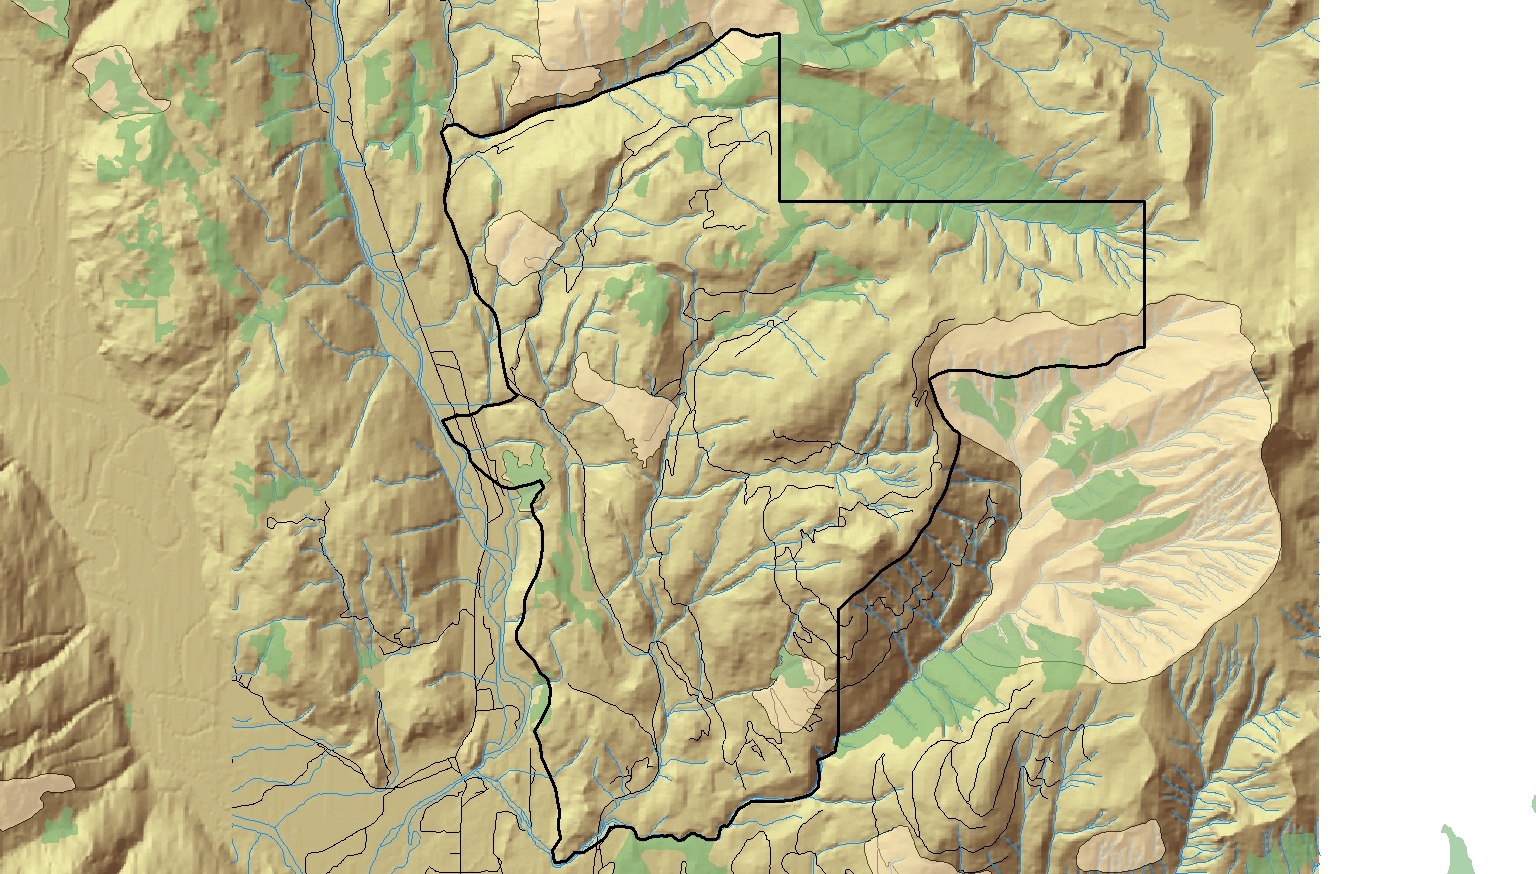
GIS analysis in Environmental Impact Assessment projects
I engaged in a detailed analysis at a macro-level for an environmental impact assessment project. I used specific data from a government database (DataBC) such as areas of old growth forest, rivers and streams, etc. to determine the areas that are unsuitable for the construction of a proposed ski resort in the area of Squamish, B.C. The visualization of different layers of spatial data is a fundamental skill of GIS application.
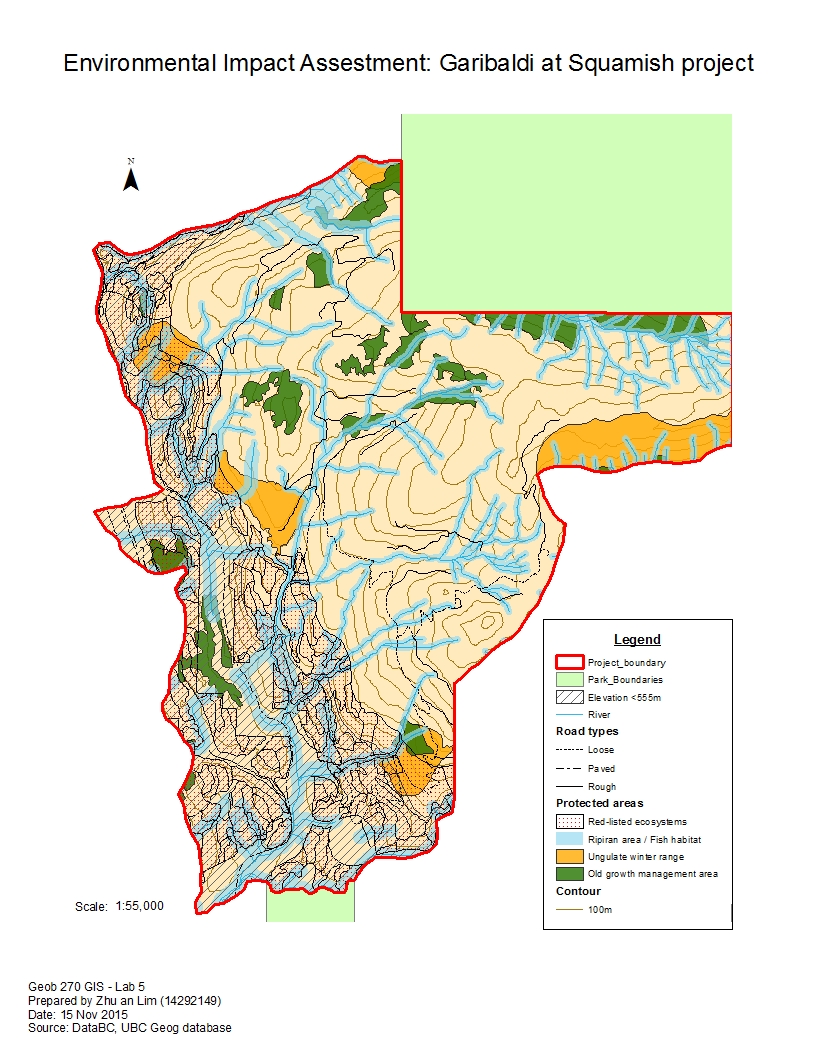
I used a variety of GIS analysis tools to conduct the environmental impact assessment, such as buffer analysis, intersects and overlays, and Structured Query Language (SQL). I am able to provide a detailed analysis of the project area and determine the possible hazards or risks to the project.
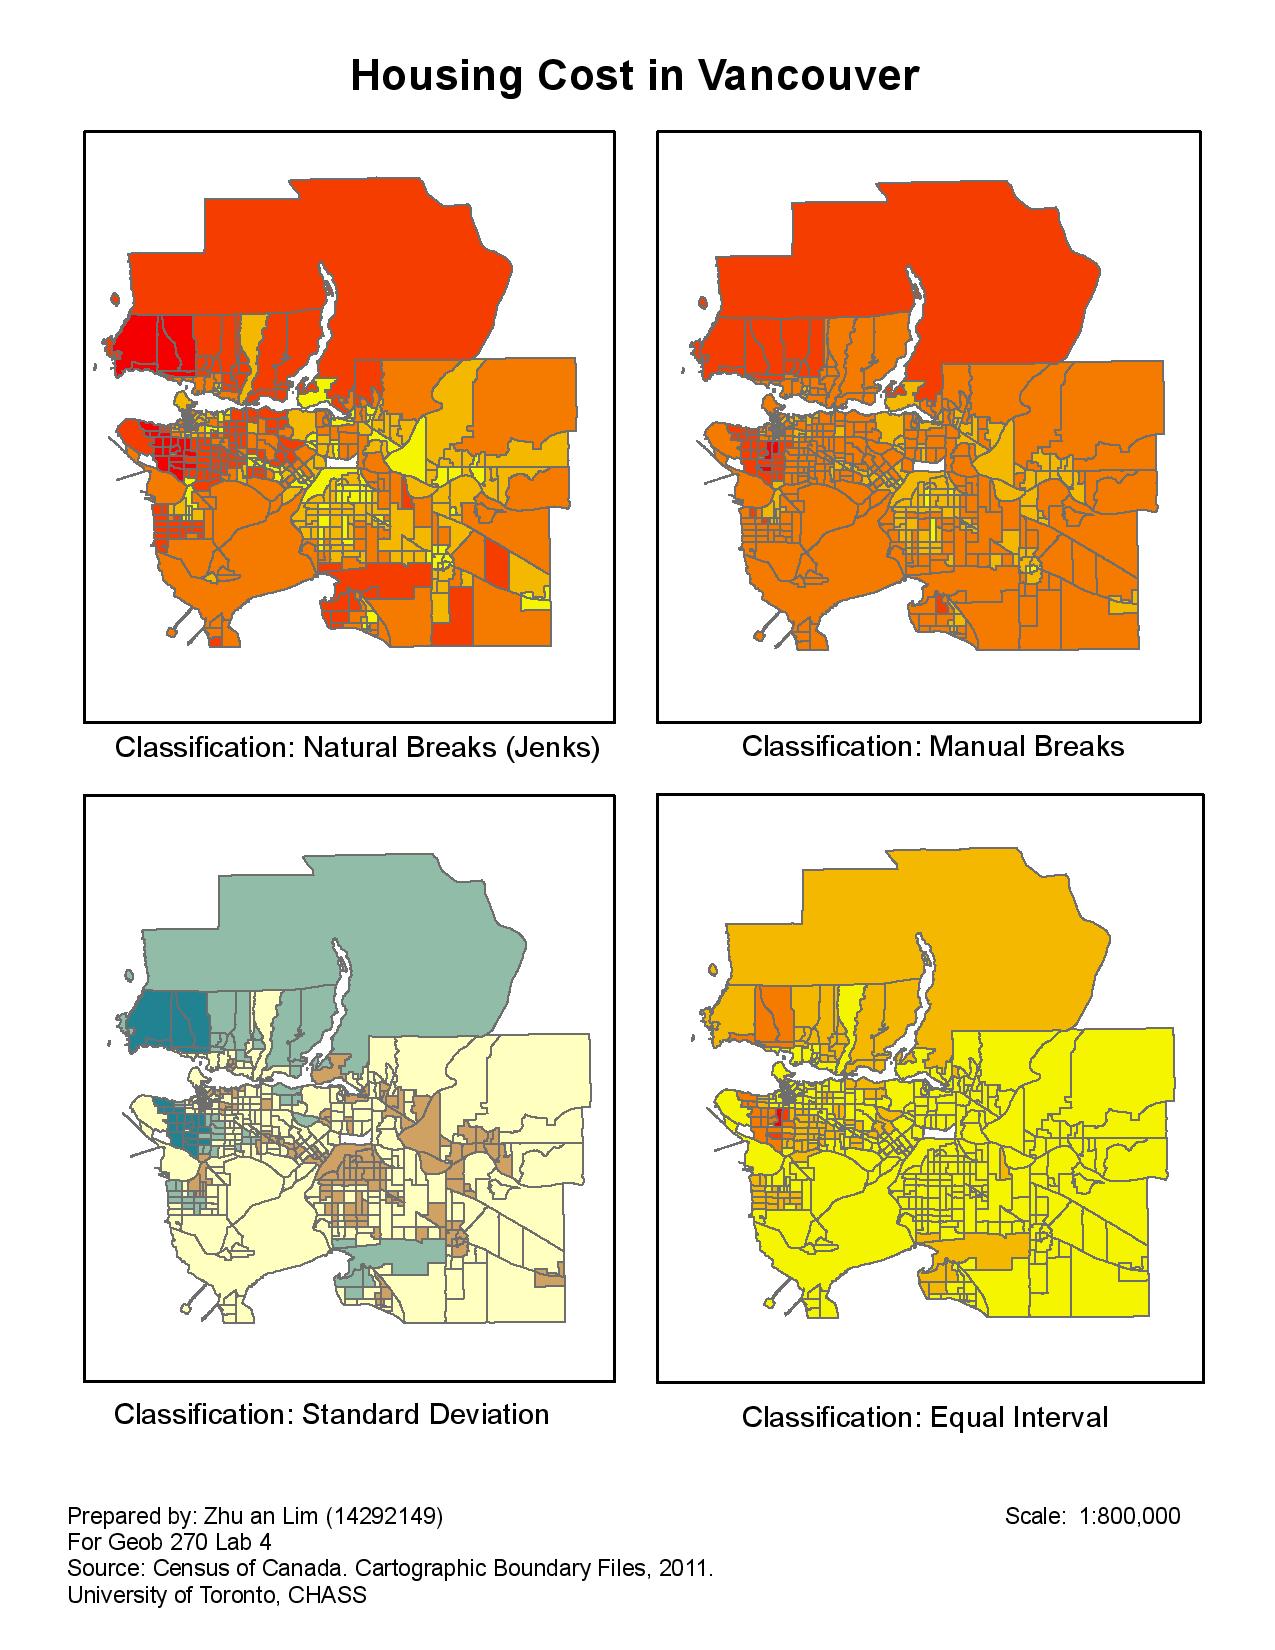
Data Classification
I used different classification methods (see map below) to show how data and information can be portrayed differently on a map, and how the audience might be influenced or misled by the way a dataset is represented on a thematic map. From the map that i created, we can clearly see how different classification methods will change the way the same dataset is presented. It is important when choosing the right classification method for a map, and a cartographer has to consider the purpose, ethics, and the impacts that a map may have on the target audience.