
Quantitative Data Classification
Classification of quantitative data is very important as different classification methods portray a very different picture to the audience (Fig 1). The type of classification for the data should be chosen based on the characteristics of the data set. For example, if the data set is random and there is no certain trends, I would choose the Natural breaks or manual breaks classification method, so that the data set is classified more evenly according to its values. If the data is evenly distributed, then a equal interval method would be a better choice.
The message that the cartographer wants to put across to his/her audience can also be affected by the classification method as well. However, we must also consider the ethical implication of choosing certain types of classification methods. For example, a real estate agent might use the equal interval method to show that areas in Vancouver have a relatively low cost to attract potential buyers, but that would be a misrepresentation of the data (Fig 1). Therefore, as cartographers and researchers, we have to take note of the types of classification used when representing our data set, and to acknowledge the ethical implications that might arise from our studies.
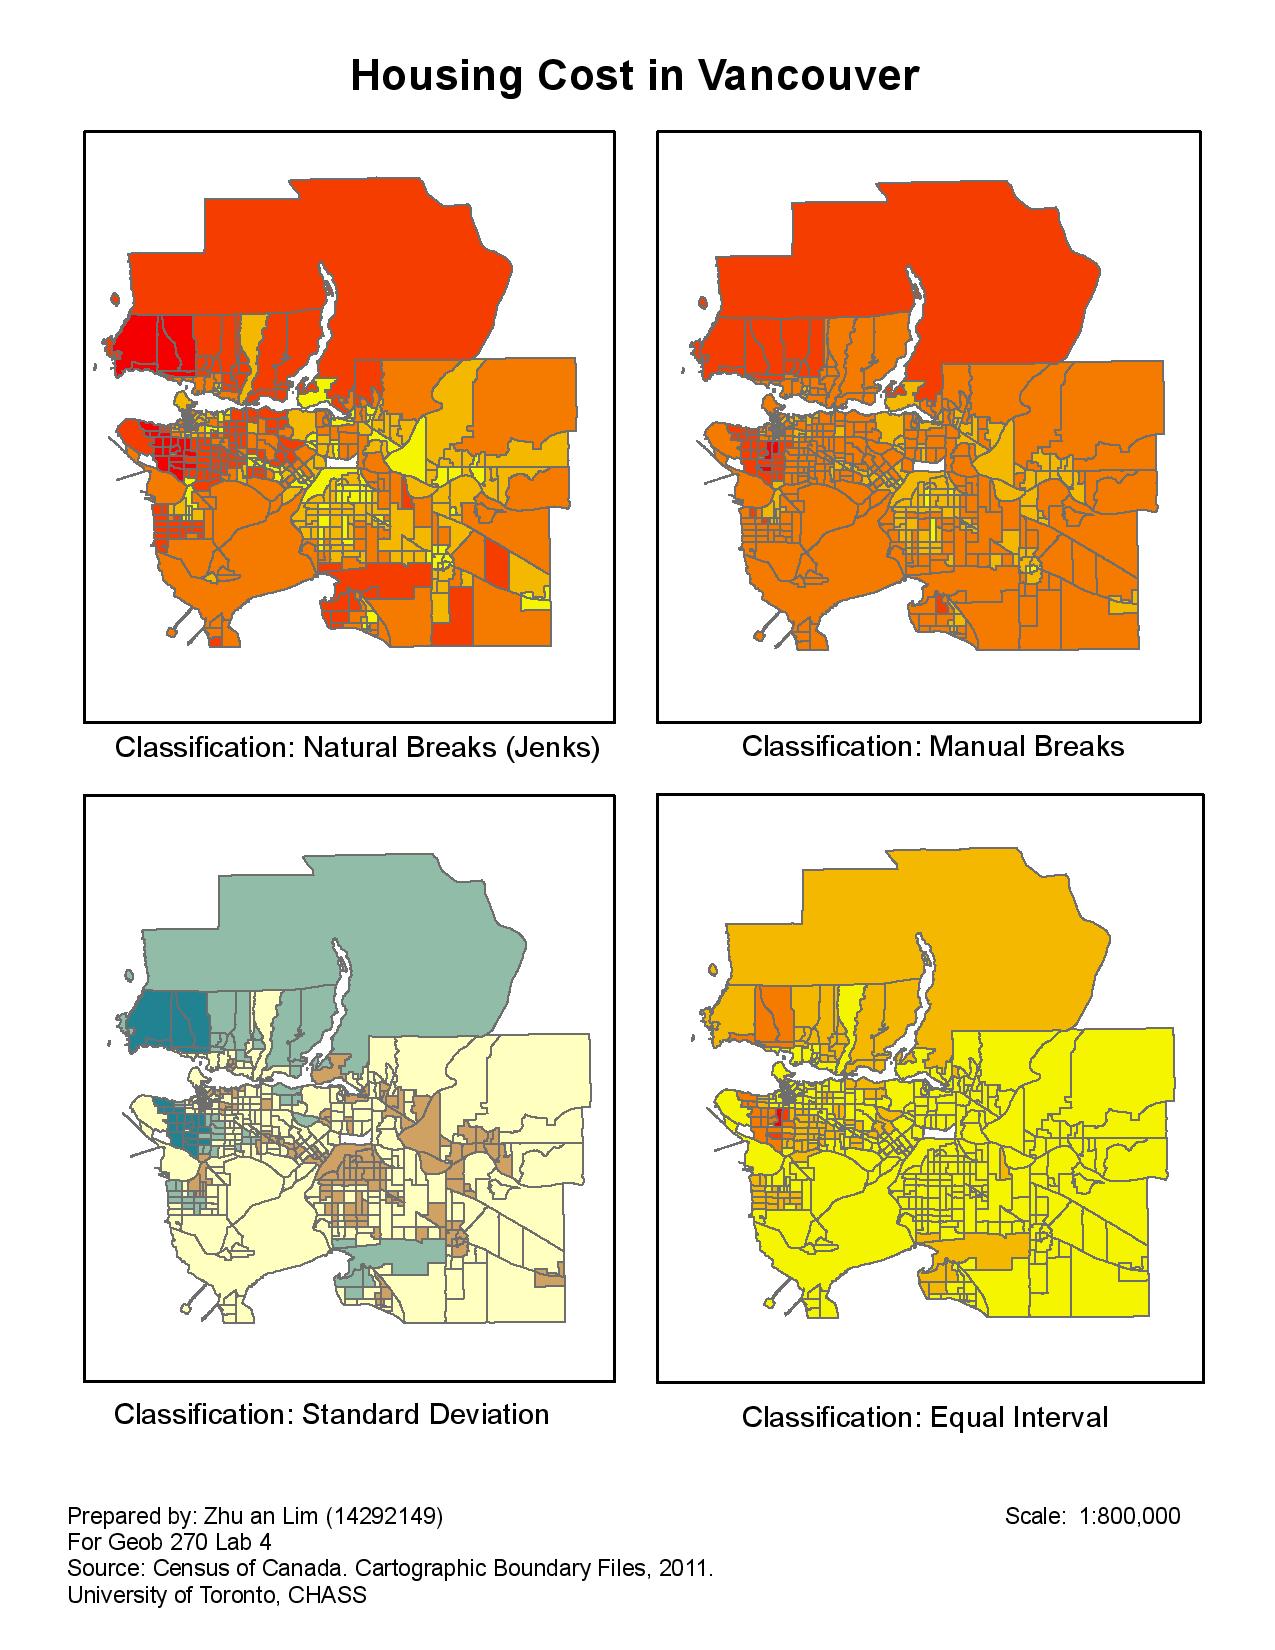
Fig 1. Different classification methods of quantitative data.