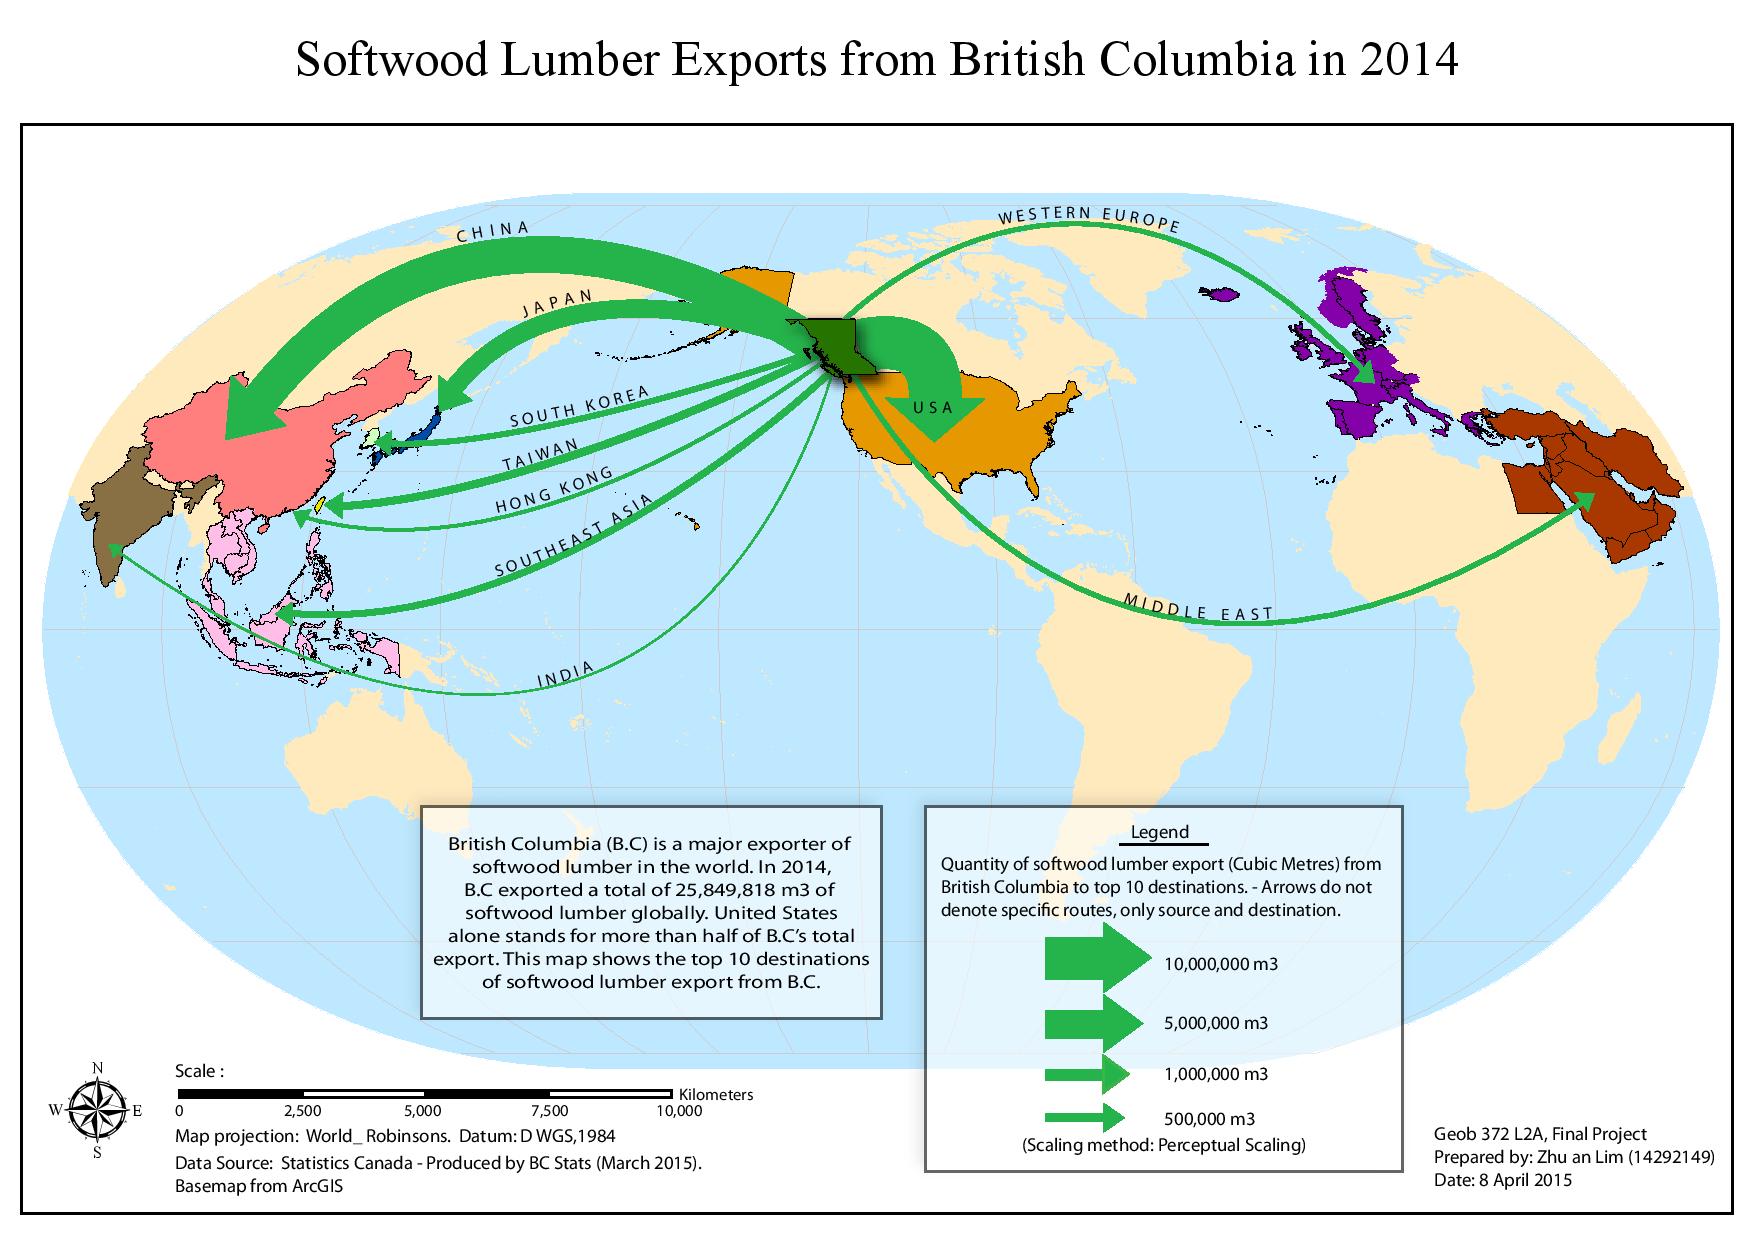
Softwood Lumber export from British Columbia (B.C)
I created a proportional symbol flow map to show the exports of softwood lumber from B.C to top ten destinations globally. I used a perceptual scaling method (Flannery) rather than absolute scaling,  in order to better distinguish between the different values for the top ten destinations. This method of scaling makes it easier to differentiate the symbols on the map, especially when there are a number of them on a single map.
A flow map is a good way to illustrate the flow of resources, population, etc. Therefore i have decide to combination of a flow map and proportional symbol map to illustrate the flow of the lumber resource internationally. Besides ArcGIS, I also used Adobe Illustrator to improve on the aesthetic aspects of the map. For example, I used the line pen tool in Illustrator to draw the different arrows on the map, and changed their width and thickness according to the perceptual scaling method.