
GIS analysis of the Agricultural Land Reserve (ALR) in Central Okanagan, British Columbia
Abstract
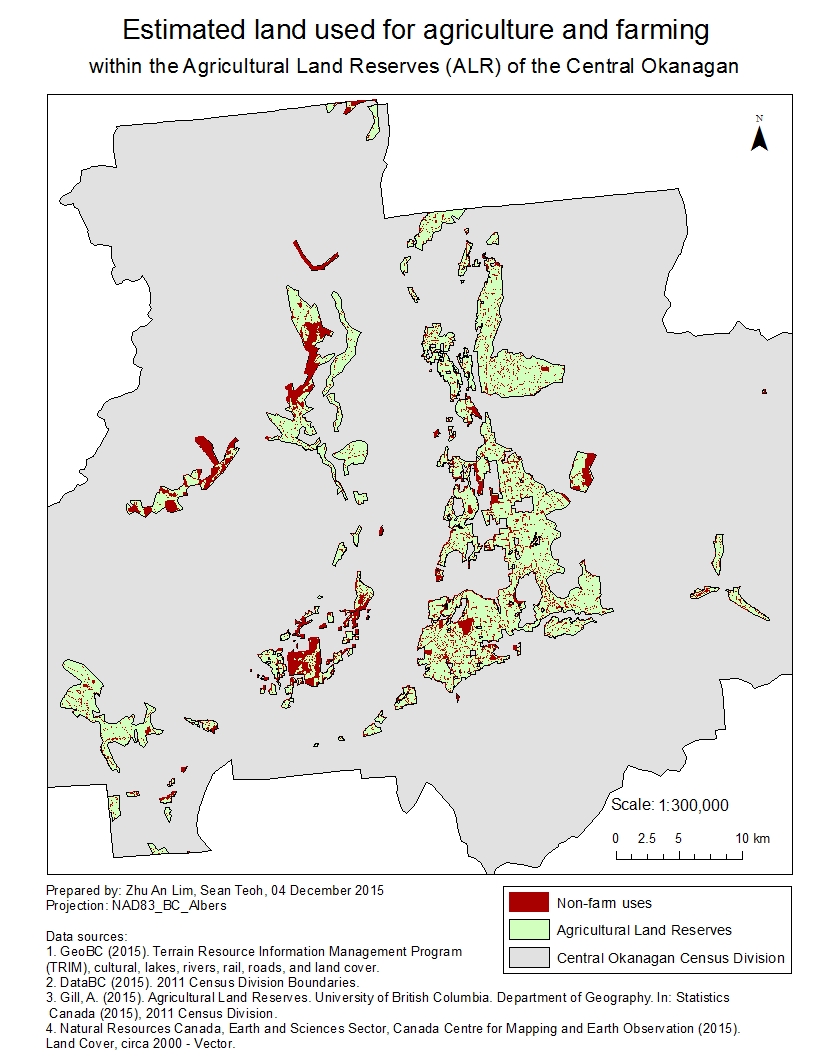
Agriculture in British Columbia (BC) currently contributes $11 billion to the regional economy, and that value is expected to increase to $14 billion by 2017. Agricultural Land Reserves (ALR) are vital for agricultural production in BC. Although estimates of the total area of ALR have been made, these numbers may contain errors due to the lack of consideration for various spatial features and non-agricultural use within the ALR. This results in inaccuracies in terms of the usable areas for agricultural production within the ALR. This project aims to improve estimates of ALR land, including only land used for agricultural or farming purposes. This was done through GIS analysis of datasets obtained from various government and academic databases. Our findings demonstrated that original estimates of the land available in the ALR for agricultural production (about 21780 ha ) in the Central Okanagan region is not accurate. After eliminating non-agricultural use, only about 20950 ha of land is usable. We found that potential threats to land for agriculture and farming include expanding urban infrastructure, logging activities and recreational areas. In addition, a small extent of hazardous areas (from mining activities and waste management) that could pollute arable land is a cause for concern.
Project management
Our team members focused on different aspects of the research, which includes data gathering, data parsing and mining (analysis), and also the write-up for the report. We also made a flowchart for the steps taken during our research, so that it is easier for the group to see the progress of the work and what is left to be completed (See attached flowchart link). Our team communicate through google drive, and uploaded files and and data as well so that other team members would have access to them. This is to make it easier for the group to know which is the most updated files to use for our analysis, and to ensure that the analysis and changes done by a group member is known .
Personal Contributions
I supported my team with my knowledge in GIS technical skills, which includes analytical tools such as proximity buffer, building Structured Query Language (SQL) for selection of attributes, etc. I also have experience in Cartography and map making, and helped to ensure that the maps for our research is aesthetic and ethical. This is important as maps can be very powerful, and it is the duty of a cartographer to ensure that the maps produced are representative of the data, and sends a clear message to the audience. I also help with the flow chart of the steps taken in our GIS analysis, as i am very familiar with the analysis tools that are used throughout our research, and also the steps taken for the construction of the final maps. I would like to thank Sean for all the time and effort he have put into this research, as we have spent hours outside of our allocated class time to complete this research, and also ensuring that all our data and results were verified.
Take-home points
- ALR are very important for the agricultural production for BC, and it is essential that more research is to be done on ALR, such as better estimates of the actual agricultural lands, potential hazards to agricultural within ALRs, and also areas that are potentially viable for more agricultural production. The current estimates of ALR lands is not accurate and does not account for the non-agricultural land use as mentioned above.
- For this project, our team used a variety of GIS analysis tools, such as a buffer proximity, building Structured Query Language (SQL) for selecting particular attributes, clipping our project boundary, and re-projection of the layers to the appropriate map projection.
- It is always difficult to work in a group, especially in a GIS project. This is because when there are more than one person working on a database, there will be confusion about which is the most updated version, and also the changes made by other members. Therefore it is always important to update a workflow process, and also label the files with dates and other information (e.g. name of member, changes made, etc.).
- Publicly available data are very common nowadays, especially with the rise with internet and public access. Although these data are useful as they are easily accessible and may provide a wide range of data, we have to be careful of the ethics and background of the data.