Choropleth maps
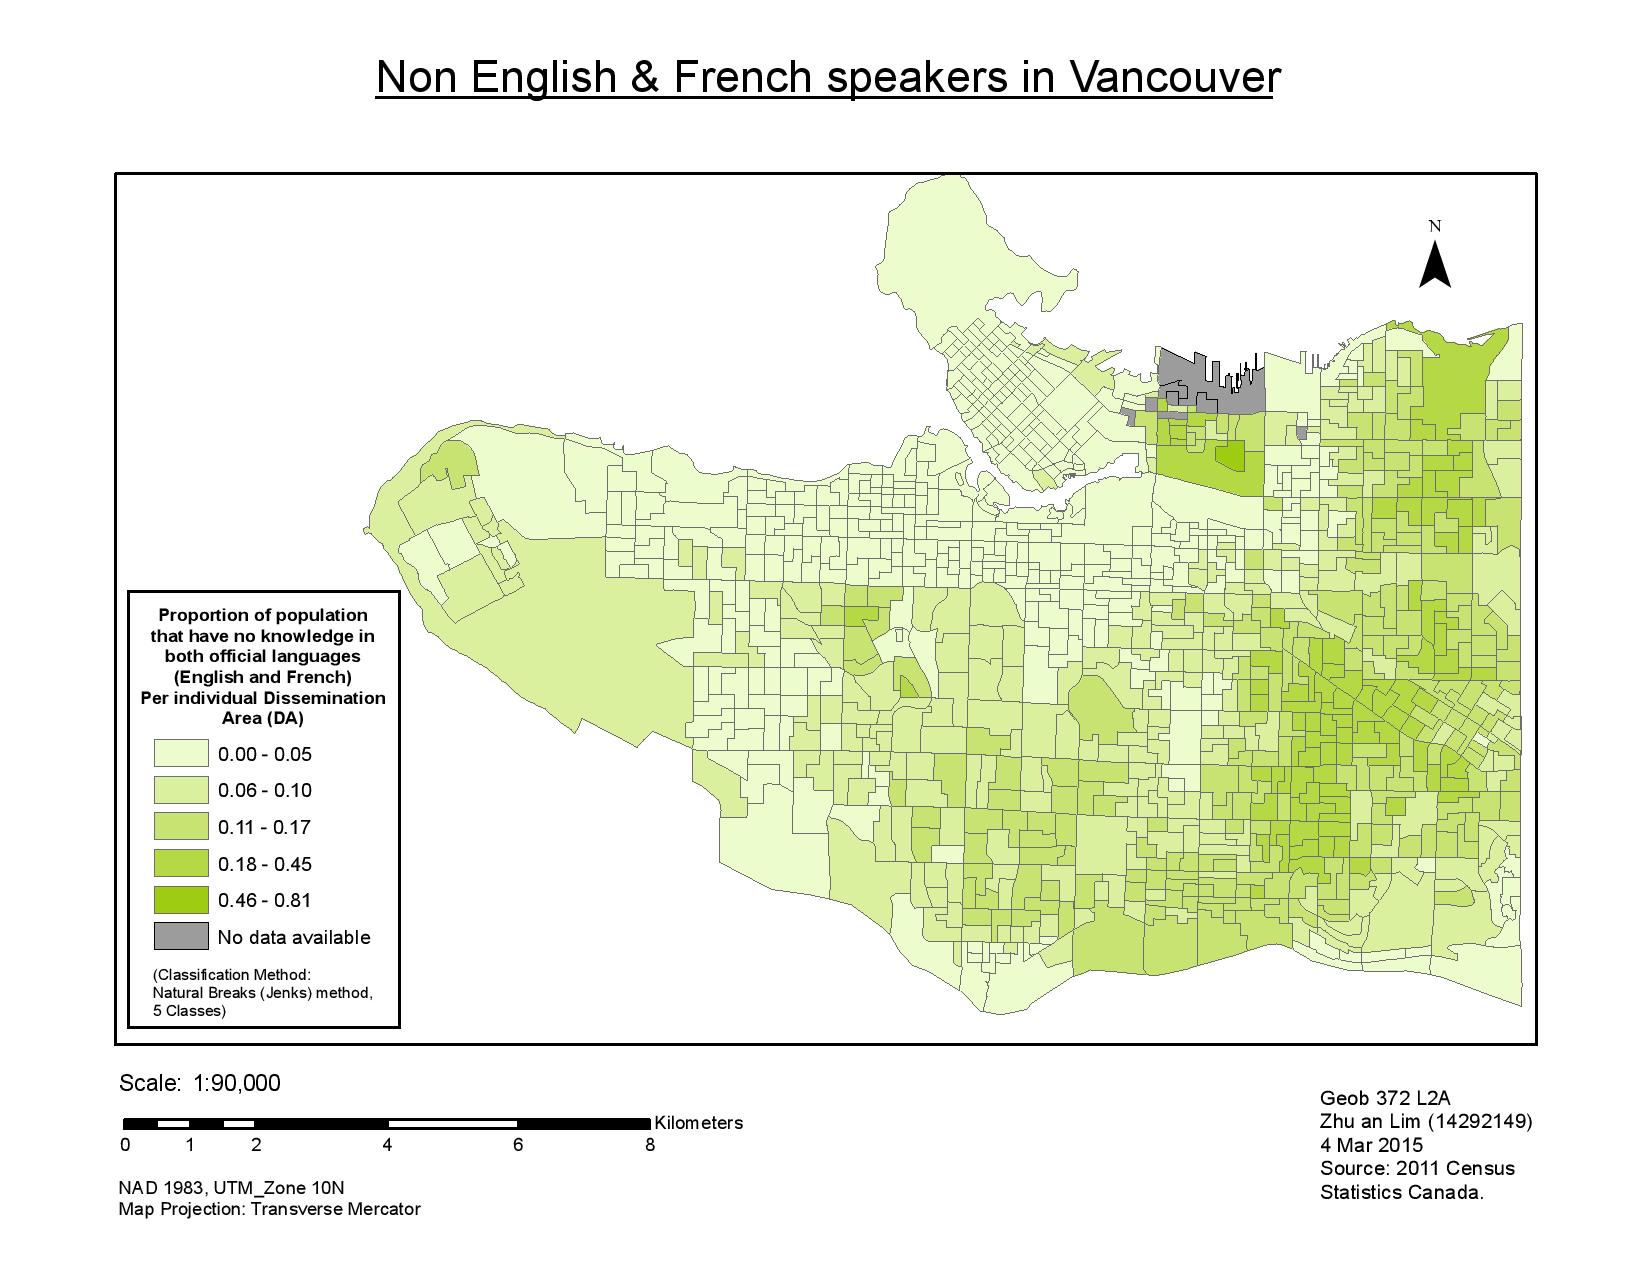
This is one of the most common forms of thematic maps, and they can be easily created using ArcGIS or any other GIS software. Using ArcGIS, i am able to join different tabular data sets (e.g. housing cost per census tract, average household income per census tract, etc.) to specific boundary shapefiles of specific geographic regions (e.g. Census tract of Vancouver). After using the join and relate tool in GIS, i am able classify my data set and choose a suitable symbology for the different classification. An example would be the two maps below, showing non English and French speakers in Vancouver. It is important to consider issues like data classification, ethics, colours and hues, positioning, etc. These are all important factors that will affect the outcome of the map and visual representation of the data.