There are numerous packages (e.g pandas, numpy) in Python that allows the processing of data to extract relevant information and perform various tasks such as sorting, plotting, grouping, as well as statistical analysis.
Using Python to process and visualize ASCII data from Acoustic Doppler Current Profiler (ADCP) sensor. The image below shows a cross sectional profile of a Sediment flux transect, with the X axis being distance and the Y axis being water depth. The Suspended Solids Concentration (SSC) in mg/L is converted from the backscatter intensity (dB) which is recorded by the vessel-mounted ADCP in a water column.
For more detailed information, check out this tutorial blog:https://medium.com/@limzhuan/visualizing-suspended-solids-concentration-ssc-using-python-5b3383b78e53 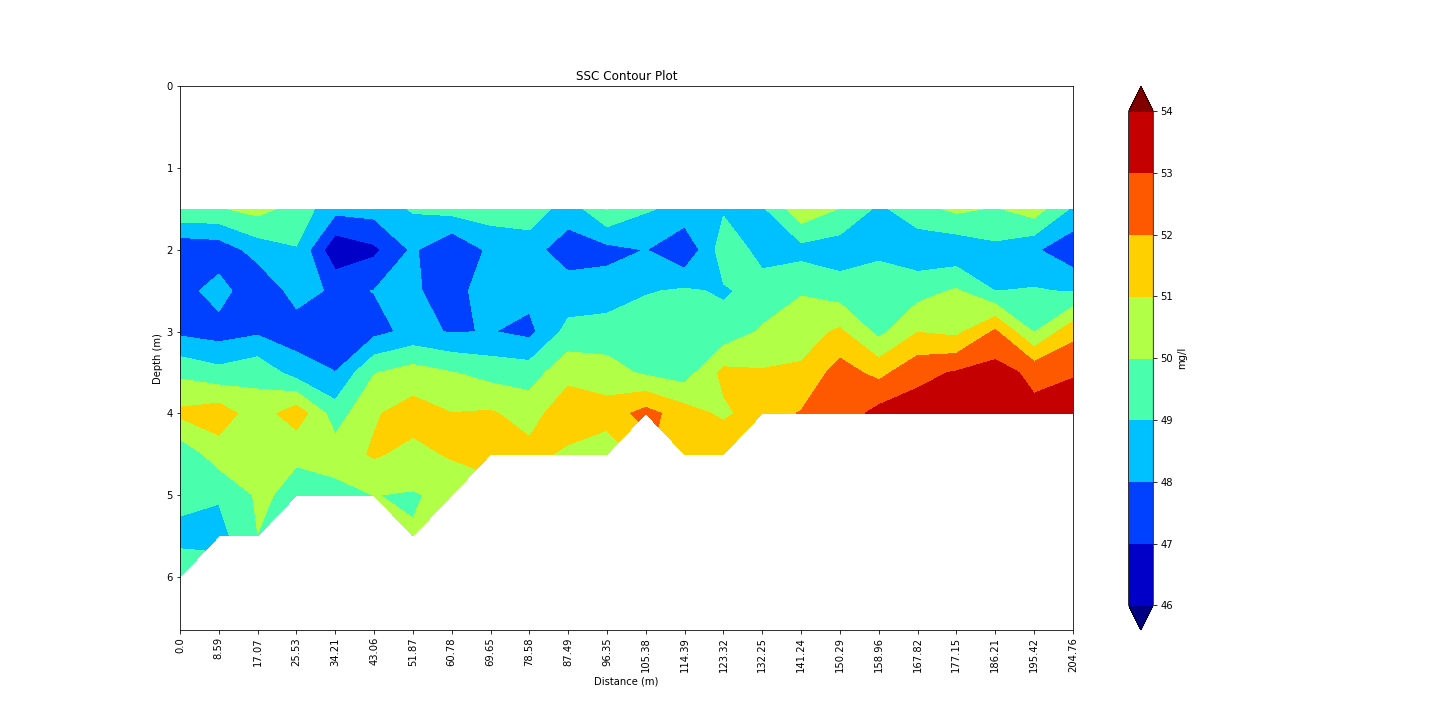
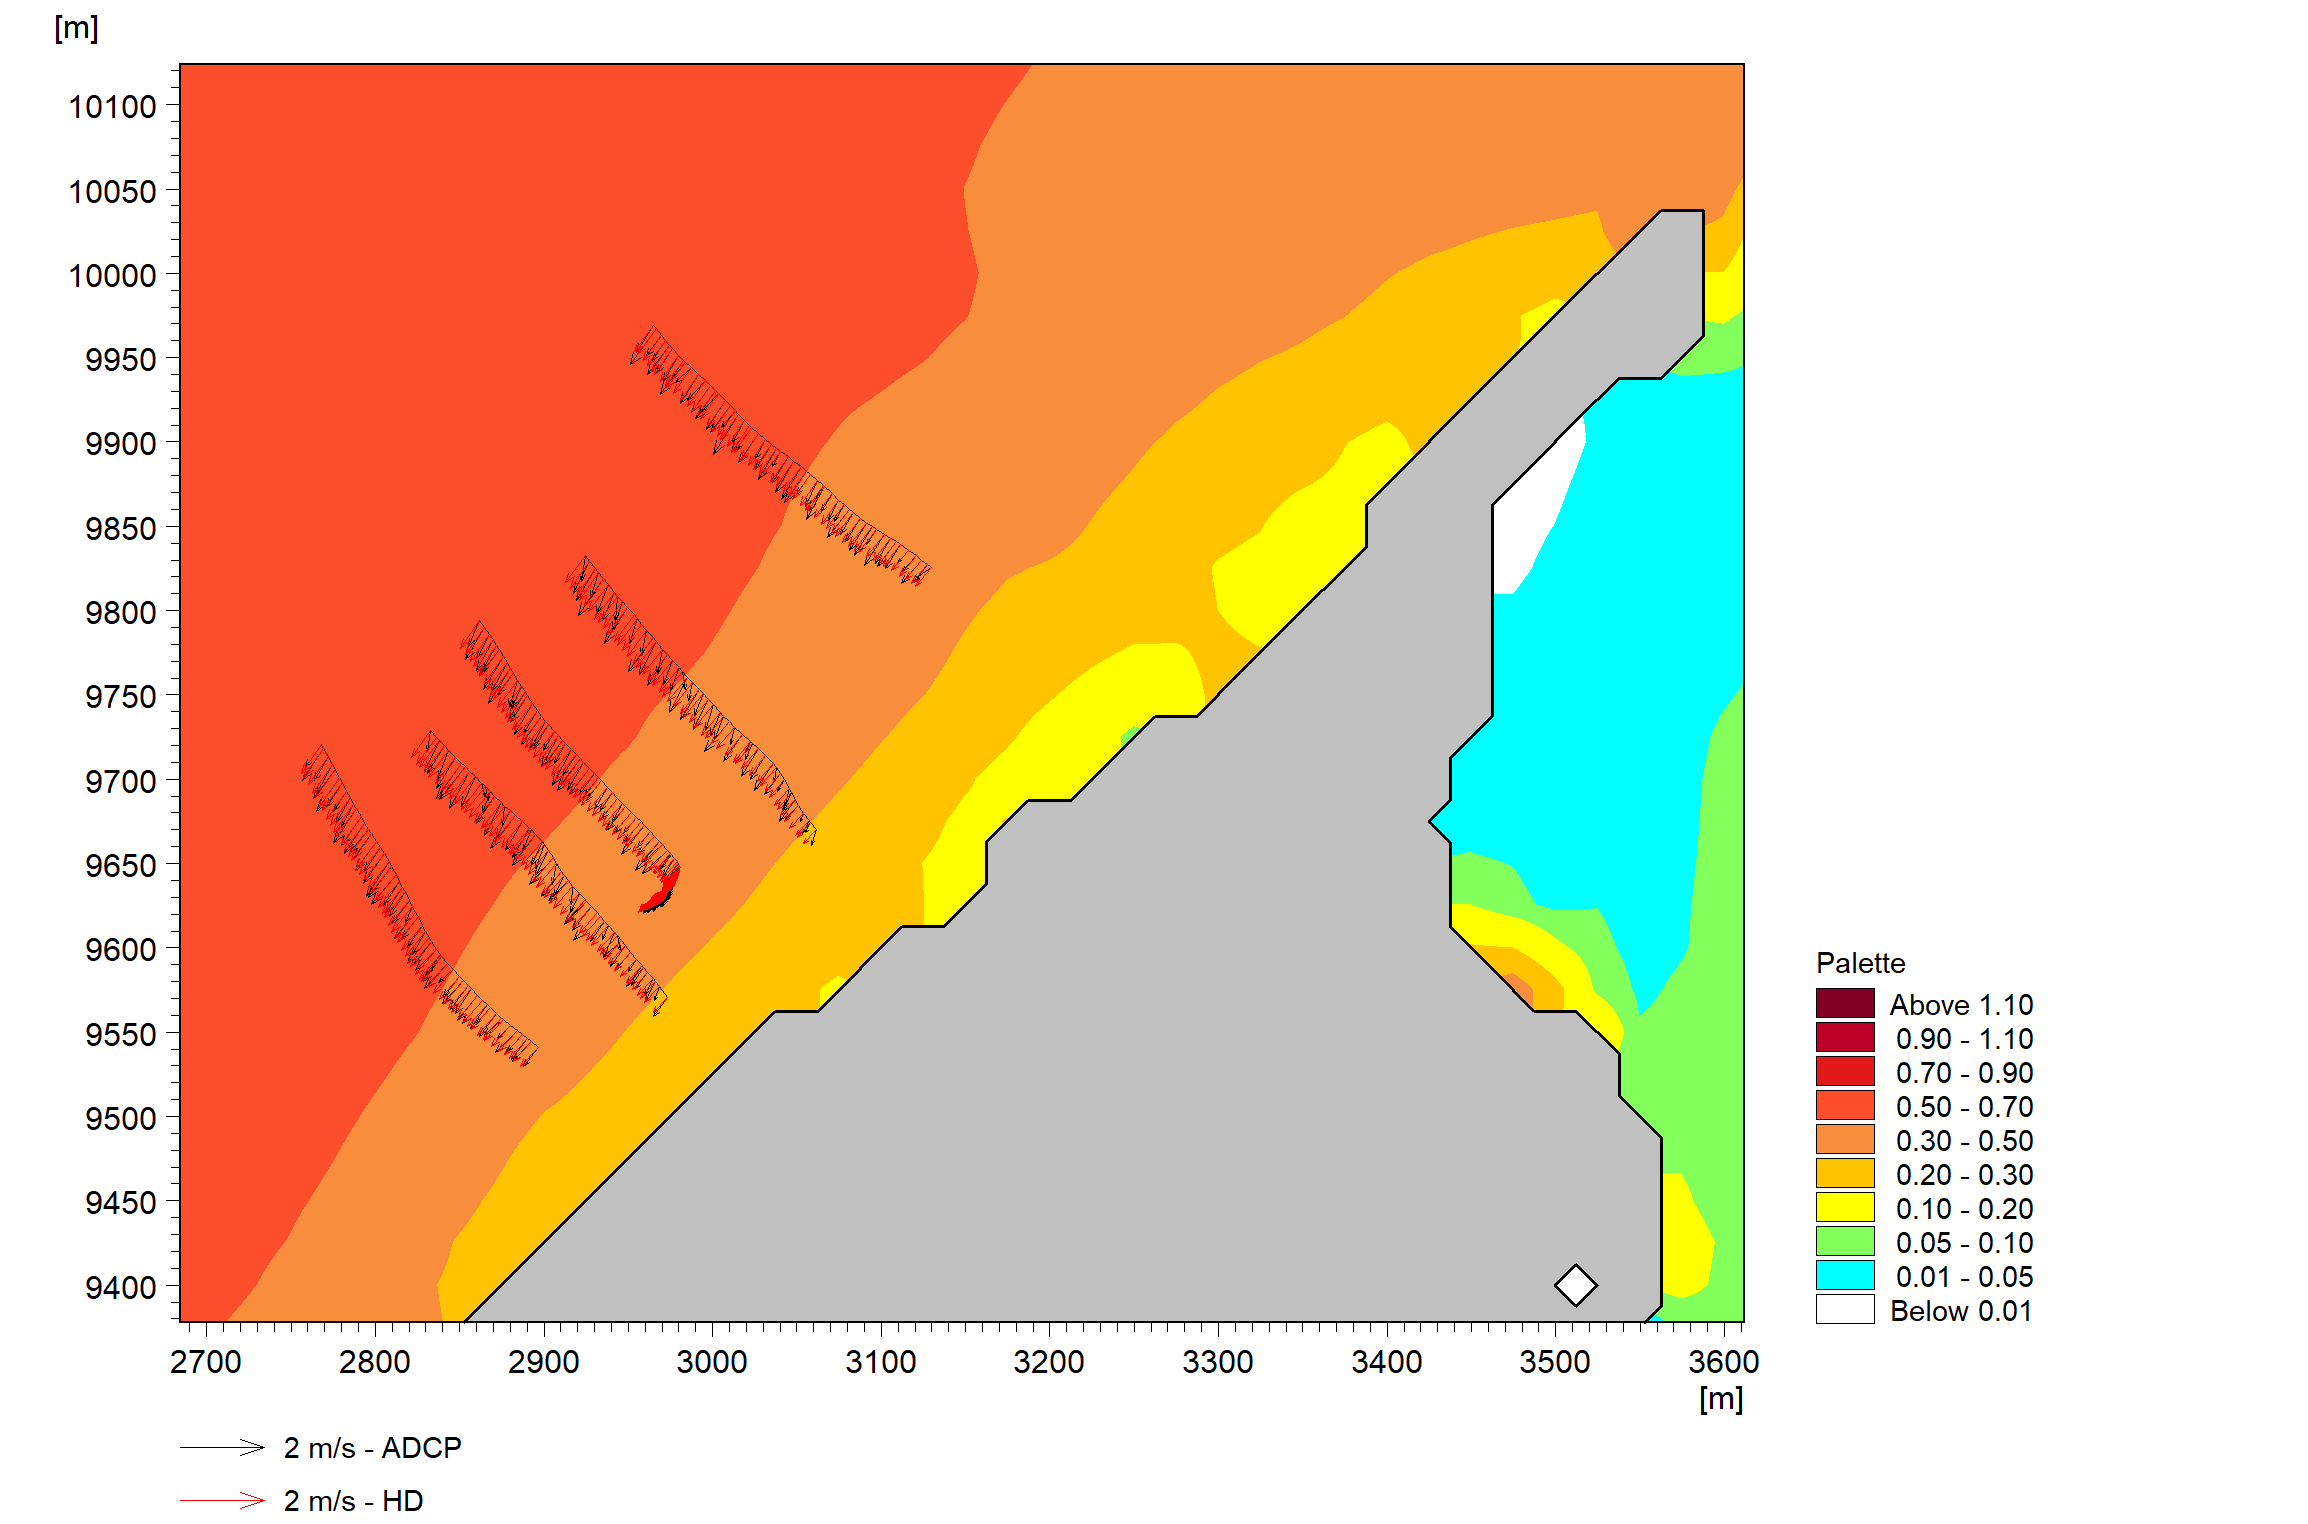
Current speed and direction can be extracted from the ASCII data as well, and can be used to compare against modelled current speed and direction from a hydrodynamic model (e.g. Mike Zero).