Si ya has instalado los medidores de nivel, ya puedes empezar a bajar datos al menos una vez al mes. Al bajar datos una vez al mes, se asegura de que el equipo esté trabajando adecuadamente. Cuando bajes los datos al computador portátil, la pantalla mostrará la curva de niveles de agua en el tiempo y se verá como aparece en la siguiente foto. Esto es muy emocionante pues aquí se ven las relaciones directas entre un evento de precipitación y los niveles de agua de las quebradas: como aumentan súbitamente y van disminuyendo suavemente.

Niveles del sensor en la quebrada Sonora
Para bajar los datos necesitarás tu computador portátil, y los cables. Es aconsejable que vayan dos personas a bajar los datos, pues de esta manera es más fácil manejar el portátil y los cables, sobretodo en un día lluvioso. Estos equipos son muy sensibles a la humedad, así que se deben seguir las recomendaciones que están en el procedimiento para garantizar que el equipo funcione al menos un año (uso de los disecantes y de grasa). Con un buen manejo, los medidores de nivel Odyssey pueden durar hasta 3 años. Todos los detalles están en el instructivo INST-04 que se encuentra en “Instalacion de equipos”.
Mientras se van recolectando los datos en el Odyssey, se pueden ir tomando los datos de los caudales. Esto se hace dependiendo del tamaño de la quebrada con dos equipos diferentes. Para corrientes pequeñas como arroyos, riachuelos o quebradas se usa el método de trazador de sal usando un conductímetro (Ver INST-05). Para corrientes medio grandes de quebradas y ríos se usa el micromolinete (Ver INST-06 e INST-07).

Bernardo midiendo caudales con el conducímetro

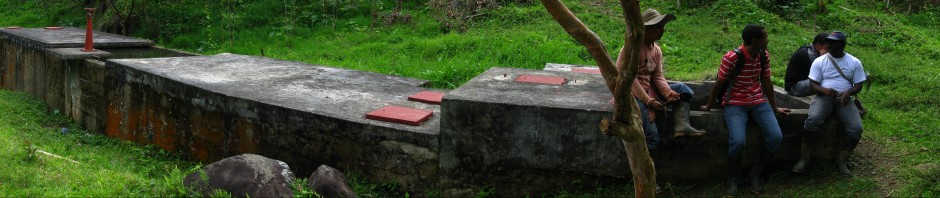
Willmar midiendo caudales con el micro-molinete
Luego de tener suficientes mediciones, al menos unas 20 a varios niveles de la quebrada, se obtendrá la relación caudal vs nivel del odyssey que se conoce como relación nivel-caudal. Con esta curva podrás obtener más adelante los valores de caudales vs tiempo. Todo esto lo podrás hacer siguiendo el instructivo INST-09.

Relación nivel-caudal para la quebrada Barbas
La siguiente es la curva de caudal vs tiempo y una vez teniendo esto, ya estarás muy adelantado y podrás hacer algunos análisis que te servirán para tomar decisiones frente al manejo del acueducto. En la siguiente página te muestro lo que hemos analizado en una de las dos fuentes del Acueducto de Tribunas Córcega.

Caudal vs tiempo de la quebrada Barbas
English version: V. Operation
Once you have installed the Odyssey level meters, you can start to download data at least once a month. By downloading data once a month, you also ensure that the equipment is working properly. When you download the data to the laptop, the Odyssey interface will show the graph of water levels over time and it will look as shown in the following picture. This is very exciting because here are direct observations of a precipitation event and the effects on the water levels of streams: levels suddenly increase and decrease smoothly.
Water level records from Sonora creek
To download the data you will need your laptop, and the Odyssey connector cable. It is recommended that two people go to the field to download the data, because this way it is easier to handle your laptop and cables, especially on a rainy day. These devices are very sensitive to moisture, so it is strongly recommended that you closely follow the instructions (in the protocol) to ensure that the equipment operates for at least one year. With good management, the Odyssey data loggers can last up to three years. All details are in the protocol INST-04, which you can dowload from the page “Instalacion de equipos”.
While you are collecting water level data, you can also take flow measurements. Our team has done this with two different methods depending on the size of the stream. For small streams we use the tracer method using a conductivity meter (See protocol INST-05). For medium to large flows we use a propeller flow meter (See protocol INST-06 and INST-07).
Bernardo measuring stream flow with the salt tracer method using the conductivity meter
Wilmar measuring streamflow with the micro-flowmeter
After having enough measurements (at least 20 at various water levels), you can generate the relation of water level vs. flow known as a stage-discharge relationship. With this relationship equation you can further obtain the curve of flow vs. time. All the steps are well explained in the protocol INST-09.

Stage-discharge relationship for Barbas creek
This is the curve of flow vs. time. After you have obtained it, you’ll have advance to the point where you can perform analyses that will aid in making decisions for better water management. On the next page I’ll show you what we analyzed from the two water sources of Tribunas Corcega Organization.

Streamflow of Barbas creek
 Follow