Cultural Jam

The original ad I chose is an American Apparel ad. American Apparel has had a long history of controversial ads that often sexualize women in an attempt to advertise their clothing. In the ad I chose, a well-dress man in American Apparel clothing is holding a woman’s bare legs apart. Although there is no text to this image besides the company’s logo, much can be inferred from the positioning of this photo.

Based on how the woman’s legs are positioned and cropped in addition to the fact that all the viewer can see on the woman’s legs are her shoes, it can be inferred that American Apparel is not trying to advertise their women’s clothing line. Instead, they portray men as the more dominant/influential figures in society through the man’s domineering stance over the woman and his firm grip on her legs. Moreover, they depict women as defenseless against men through the woman’s position in the photo—upside down and on her back. Through the positioning and crop of this photo, this ad subconsciously tells viewers that women are nothing more than sexual objects for men.

It should also be mentioned that the American Apparel logo is tactically placed in between the legs of the woman and on the man’s crotch. This draws the viewers’ attention to the bottom of the photo where most of the ad’s sexual suggestion is occurring while drawing attention away from the actual clothing at the top of the photo. As such, I will be addressing the sexualization of this photo with my jamming.


Advertisements can be made that do not attack feminism. Through my jammed work, I wanted to invoke that advertisements do not have to be made sexual to get a message across. I replaced the woman’s legs with articles of clothing in addition to moving the American Apparel logo. I did so to 1) desexualize the message behind the ad and 2) use the ad to actually advertise the company’s clothing.

Through replacing the legs with clothes, the ad no longer implies that women are sexual objects for men and that men are more “dominant/powerful” than women. Now that the man is holding clothes, it does not sexualize women nor does it sexualize men. Furthermore, through moving the company logo to the top left corner, it takes the viewer’s attention away from the man’s crotch thereby further desexualizing the ad by placing more emphasis on what the man is wearing and what he is holding. This puts more of a focus on the clothing line itself as opposed to the implicit sexual messages previously.

The new ad makes it look as though the man is in the process of choosing which article of clothing to wear or that he is showing off his wardrobe. This promotes American Apparel’s men’s clothing line by featuring different objects of clothing from t-shirts to accessories like socks and ties. It is important to advertise the variety of clothing because not all men want/need business casual—some prefer a more casual style, which they can clearly see being advertised in the new ad.

Coral Reef Degradation

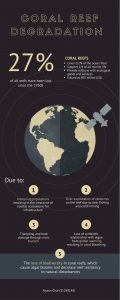
Coral reefs are one of the oldest ecosystems on Earth covering only 0.2% of the ocean floor, and, yet, supporting about a quarter of all marine species (Cesar et al. 2003). Not only do coral reefs benefit aquatic life, but they also provide millions of people with necessary ecological goods and services including food, recreation, coastlines, and aesthetic benefits (Moberg 1999) valued at a total of USD$ 800 billion globally (Cesar et al. 2003). However, although reefs have the capability to support many through the services they provide, they are in a severe decline. Particularly, reefs in embayments and near highly populated areas are experiencing a disproportionate amount of stress associated with terrestrial deforestation, agriculture, and urbanization (Moberg 1999). Add to that global warming, and the future of our coral reefs looks bleak. Since the 1930’s, 27% of all coral reefs have been lost with an additional 30% at risk of being lost in the next 30 years if our present rates of destruction continue (Cesar et al. 2003).  In order to preserve these fragile ecosystems, we need a better understanding of the dynamic nature of coral reef ecosystems, the processes that threaten them, and the processes contributing to their resilience.

To understand the threats to coral reefs, we first need to understand the how corals grow and develop. Corals have an important symbiotic relationship with the microalgae, zooxanthellae. Zooxanthellae live within the tissues of the corals and provide them with the nutrients they need to grow, reproduce, and feed in addition to providing them with their bright colours (Moberg 1999). In return, corals provide the algae with the ammonia and phosphate they need to survive. Because zooxanthellae need light to photosynthesize, corals are limited to clear, shallow waters with temperatures between 18 and 30 °C and depths less than 100 m. This symbiotic relationship explains why corals are so sensitive to changing environmental conditions.

Coral reef degradation occurs when a reef system is unable to recover and regenerate following a disturbance, which is a consequence of losing resilience (Moberg 1999).  When natural disruptions are paired with chronic human activity it puts a tremendous amount of stress on the reefs impairing their ability to regenerate. As coral reefs degrade, algae invades the system, lowering biodiversity (Bellwood et al. 2004; Moberg 1999). This YouTube video neatly sums up the complex environment corals live in and how coral reef degradation will affect the resiliency of the system: https://www.youtube.com/watch?v=U8TQoCykaKU.

Coral reefs are threatened by numerous anthropogenic disturbances. Many of which are associated with population growth.

  1. Population growth causes many communities to over-develop coastal areas. By using landfills to build houses and infrastructure, the amount of sediments delivered to the ocean from runoff increases, which can smother the coral and promote algae growth.
  2. The over-exploitation of reef resources has led to coral reef degradation. The higher demand for various types of seafood including fish, seaweeds, crustaceans, and mussels in coastal communities has led to overfishing. As fishing yields decline, fishermen have resorted to more damaging methods such as dropping dynamite and injecting cyanide into reefs to maximize their catches. The repetitive use of explosives and cyanide on a reef can turn this ecosystem into rubble and impair regeneration.
  3. In some countries, coral is mined to create building materials such as limestone and cement. Coral mining destroys the reefs that protect coastal areas from wave action and storms. It also changes the “topography of the reef flat and, as a result, alters the pattern of water flow resulting in increased beach erosion” (Souter 2000, page 663)
  4. Mass tourism threatens reefs through careless practices. Tourists who dive and snorkel can cause direct damage to reefs through trampling, contact with hands and fins, as well as through boats (Cesar et al. 2003). Moreover, increasing tourism can bring about unplanned coastal development that erodes beaches and increases sedimentation.
  5. Increasing CO2 concentrations slow coral calcification by 17-35% and acidify oceans. Ocean acidification not only impacts the calcification of corals, but it also has lasting impacts on other biological processes such as photosynthesis, fecundity, and oxygen exchange (Knowlton 2001).
  6. Global warming is causing sea surface temperatures to rise, which causes the “bleaching” of corals. Coral bleaching happens when corals become stressed due to these elevated sea surface temperatures. This causes corals to expel or ingest the zooxanthellae that give them their colour, revealing the calcium carbonate skeleton, which gives corals a “white” appearance (Moberg 1999). If stresses are removed from the reef, corals may recover when zooxanthellae return, but they are unlikely to recover if they have been exposed to a stress for a long time. As their symbiotic relationship with the algae is lost, coral growth and resilience become impaired. This YouTube video sums up corals’ relationship with zooxanthellae and coral bleaching with reference to the Great Barrier Reef: https://www.youtube.com/watch?v=UyEw_Rl8mqM.

Degraded reefs no longer protect shorelines and they can no longer support the fish and invertebrates that depend on them. This translates to decreased fishing yields, which can impact food security and increase poverty. Furthermore, tourism and its revenue are also lost when coral reefs are no longer aesthetically appealing. Countries who depend on this income will drive themselves further into poverty. Therefore, it is important to not only protect the reef itself and the surrounding ecosystems, but we also need to actively manage our greenhouse gas emissions internationally to minimize our impact on the environment and to keep global temperatures from rising.

To protect coral reefs we must conserve the resiliency of the system by maintaining biodiversity through effective management that minimizes human impacts (Moberg 1999). This can be done in a few ways:

  1. Place an economic value on coral reefs as well as the goods and services they provide to people and marine life. This can improve conservation efforts and management techniques (Moberg 1999). Economic valuation can also help governments assess monetary losses when reefs are damaged (Cesar et al. 2003).
  2. Establishment of marine reserves and no-take areas (NTAs) that protect reefs from extractive activities like fishing (Hughes 2003). They are effective in preserving fish populations as they alter human behaviour; however, it should be noted that NTAs do not protect reefs from bleaching. This YouTube video explains the problem with over-fishing and explains how no-take areas will benefit reef ecosystems. It also outlines how we can change our habits so we do not over-exploit reef resources https://www.youtube.com/watch?v=eVJ7Prt5OdA.
  3. NTAs need to be complemented with international policies aimed at reducing the rate of CO2 emissions and global warming.

If we continue to neglect protecting coral reefs and the ecological goods and services they provide us, it “could ultimately compromise the sustainability of humans in the biosphere” (Souter 2000, page 658). It is now a priority to minimize our impact on these systems so corals can maintain their resiliency to various disturbances; otherwise, it is likely that we will see the end of such breathtaking ecosystems.


Works Cited

Bellwood, D. R., Hughes, T. P., Folke, C., & Nyström, M. (2004). Confronting the coral reef crisis. Nature, 429(6994), 827-833. doi:10.1038/nature02691

Cesar, H., Burke, L., & Pet-Soede, L. (2003). The Economics of Worldwide Coral ReefDegradation. Cesar Environmental Economics Consulting, Arnhem, and WWF-Netherlands, 14, 1-23.

Hughes, T. P. (2003). Climate Change, Human Impacts, and the Resilience of Coral Reefs. Science, 301(5635), 929-933. doi:10.1126/science.1085046

Knowlton, N. (2001). The Future of Coral Reefs. Proceedings of the National Academy of Sciences, 98(10), 5419-5425. doi:10.1073/pnas.091092998

Moberg, F., & Folke, C. (1999). Ecological goods and services of coral reef ecosystems. Ecological Economics, 29(2), 215-233. doi:10.1016/s0921-8009(99)00009-9

Souter, D. W., & Lindén, O. (2000). The health and future of coral reef systems. Ocean& Coastal Management, 43(8-9), 657-688. doi:10.1016/s0964-5691(00)00053-3

Reflection on the Course

GEOB 270 contributed to my understanding of GIS functions and applications. From this course, I learned how to use various GIS analysis tools in multiple scenarios to conduct a comprehensive analysis on areas of interest. What surprised me about GIS was how easy it is to use and how really anyone can have access to the governmental data that can be used. All in all, I realized that it is one thing to access the data and be able to throw it all in ArcGIS to create a map, but it’s another thing to actually understand the data and its metadata in order to create ethical, user-friendly maps.

Proposed Locations for the Pineapple Palace Resort and Spa

We decided to conduct and analysis on the Island of Hawai’i to ultimately find the three safest locations on which we can build the Pineapple Palace Resort and Spa (yellow stars). We wanted to find locations that kept our guests safe but also allowed them to be near the ocean and have easy access to nearby attractions and towns.

Final Project

For this project I worked with 3 other people: Camille, Kristina, and Nicole. Each person took a different section to work on while we all collaboratively worked on the introduction and conclusion. While I was gathering data and putting them into ArcGIS, other group mates started working on creating the maps, outlining the flow chart, and beginning the write up. When we weren’t in lab, we would communicate via Google docs and Facebook.

As a result of the process, I learned that there are many different factors that you need to take into account when planning to build somewhere. We only gathered data from a handful of different layers, but there are much more environmental concerns that need to be taken into account, such as areas of endangered animal species, soil layer composition, etc. It’s interesting that most of the hotels built on the Island of Hawai’i are in the tsunami evacuation zone, and because we did not want to put our guests in danger, we decided not to build in these zones.

In regards to teamwork/project management, I leaned that it is very difficult to schedule a meet up time with group members outside of the scheduled lab time to complete the project. I also learned that someone needs to take control and lead the group. Because the data is stored on the H drive, which is is linked to one person’s account, it’s difficult to allow other members to work on the map in ArcGIS if they don’t have access to your data.

We had no problem acquiring the data from the Hawai’i Office of Planning website, and we knew it was accurate and could be trusted, but we weren’t really sure if this data was up to date.

Geob270FinalProject

Environmental Assessment for the Garibaldi

Protected AreasHillshade

The Garibaldi and Squamish project is a proposed mountain resort 15 km north of Squamish on Highway 99. In 2010, the BC Environmental Assessment Office released a report stating that the project lacked effect on vegetation, fish, and wildlife habitats. Five years later, in 2015, developers filed an application claiming that they addressed these issues. I have been hired as a natural resource planner by the British Columbia Snowmobile Federation who initially opposed the proposed project. In order to fully assess whether or not building the Garibaldi is plausible, I had to examine BC’s Environmental Assessment’s recommendations as well as project criticisms.

In order to assess and analyze the impact of the project, I had to acquire the data from DataBC, parse the data, filter the data, mine the data, and produce a final map of the data. Ultimately, I found that 53.8% of the total project area falls in protected areas where we cannot build. This leaves a limited amount of space for the project to be developed. Because of the limited space available, and the size/location of the Garibaldi, I do not believe that this project should be allowed to continue. This result does not differ from what I wrote in my initial memo.

ACCOMPLISHMENT STATEMENT

Applied data visualization strategies of data acquisition, parsing, filtering, mining, and representation to my data in order to create a complete impact assessment.

Housing Affordability

QUANTITATIVE DATA CLASSIFICATION

dataclassIf I am a journalist putting together maps of housing cost in Vancouver, I would use the Natural breaks method for my audience because it gives the most accurate and easily understandable representation of the median house prices. However, if I were a real estate agent preparing a presentation for prospective home buyers near UBC I would probably use the equal interval classification method because it makes areas look less expensive than they actually are; therefore, people will be more willing/likely to buy these expensive homes. Technically there are no ethical implications to using this method as opposed to the natural breaks method because you, as a real estate agent, are not changing the data; you are only using a different classification method that works in your favour.

HOUSING AFFORDABILITY

housecostVO

Affordability is measuring the ratio of the housing cost over the median household income. It’s a better indicator of housing affordability than housing cost alone because some people may have higher incomes than other people but still have the same shelter costs. The 12th Annual Demographia International Housing Affordability Survey in 2015 provides us with housing affordability rating categories, which separate the data into levels of affordability/unaffordability depending on median multiple. Because data was collected by professionals in urban planning, the data can be trusted. Although the maps provided show users that Vancouver is severely unaffordable, it is important to note that an unaffordable city does not mean an unlivable city. Affordability only tells us about a population’s ability to pay for housing whereas livability relies on multiple factors such as economic status of a city, social status, education, etc.

ACCOMPLISHMENT STATEMENT

Understood the different methods of classifying data: manual breaks, natural breaks, equal interval, and standard deviation in order to represent how each of these methods led to different looking maps.

Tsunami Risk Areas in Vancouver

GEOB 270 Lab 3 Map (1)In the event of a tsunami, approximately 1.38% of Vancouver’s total area will be in danger. To get the percentage of Vancouver’s total area in danger, I summed up all the areas in danger (I got 1807225.594473 m2) and then I got the City of Vancouver’s total area from the “Vancouvermask” (which was 131033339.950334 m2). I divided the amount of area in danger by the total area in the City of Vancouver (1807225.594473 / 131033339.950334) x 100% and I got 1.38%.

Healthcare facilities in the Vancouver danger zone:  FALSE CREEK RESIDENCE, VILLA CATHAY CARE HOME, BROADWAY PENTECOSTAL LODGE, YALETOWN HOUSE SOCIETY.

Educational Facilities in the Vancouver danger zone: EMILY CARR INSTITUTE OF ART & DESIGN (ECIAD), INSTITUTE OF INDIGENOUS GOVERNMENT (IIG), HENRY HUDSON ELEMENTARY, FALSE CREEK ELEMENTARY, VANCOUVER MONTESSORI SCHOOL, HERITAGE 3R’S SCHOOL, ST ANTHONY OF PADUA, ECOLE ROSE DES VENTS.

To get to my answer, I went into the Arctoolbox function under Analysis Tools, clicked on intersect, and put in “Education” and “Vancouver_Danger” into the input features. This would find the points of education that intersect with/fall in the Vancouver danger zone. Then I pressed “ok” and named it Vancouver_education. I then re-did it for the healthcare data. After I got the points of educational facilities and healthcare facilities that are in the Vancouver danger zone, I checked their attributes table by right slicking on the layer to find the names of these facilities

SKILLS ACQUIRED

  1. Used my knowledge of GIS software and applications to describe data integrity and ethical implications for maps
  2. Managed and changed data projections in order to fix misaligned and improperly referenced data
  3. Conducted a basic geographic analysis involving buffers and reclassification on the City of Vancouver to determine areas vulnerable to possible tsunamis

Misaligned and Improperly Referenced Data

DEALING WITH MISALIGNED AND IMPROPERLY REFERENCED DATA

Different projections preserve different properties (i.e. Mercator preserves angles and directions, Albers Equal Area preserves areas, Lamberts Conformal Conic preserves angles, etc.); thus, when data is projected onto different coordinate systems properties become distorted. When you want to combine different layers of data that are improperly referenced or misaligned you would go into “Properties” in ArcCatalog under the “XY Coordinate System” tab and choose the most appropriate coordinate system. If you need to preform spatial analysis, it is better to change the projection of the layer to a common spatial reference system, which creates a new data layer with a different coordinate system. To do so, you go into ArcToolbox, find Data Management Tools > Projections and Transformations > Project. Input Dataset should be the layer you wish to project and output coordinate system should be the common coordinate system.

USE OF LANDSAT

Landsat is a remote sensing technique used to measure the response of objects and surfaces on the earth. This includes vegetation distribution, land use change, water features, etc. The advantage of Landsat is that observations have been taken since 1972, which provides us with multiple images in different time frames so we can figure out the types of changes taking place. Landsat was especially useful after the Mt. St. Helens earthquake and eruption in 1980 to determine how the surrounding landscape changed.