Achievements:
Since our last blog post, we have achieved two major accomplishments:
- We have contacted many of our assets and have received some response in return. We have been recording the information that we found onto our excel document. Through email and over the phone, we have been explaining our project with assets in Vancouver.
- We have been in contact with our community partner and have scheduled our trialling sessions with community members. We have scheduled for two different dates to trial the map with two different demographics
Weekly Objectives Until Project Completion
Saturday November 5th
- Trialling the Map at The Farmer’s Market in Riley Park.
- We will collect feedback from a diverse crowd of the farm market.
- We have been given the space to trial the map amongst the farmers market customers and the individuals in Riley Park. The location of the market is distanced from the Little Mountain Community Center.
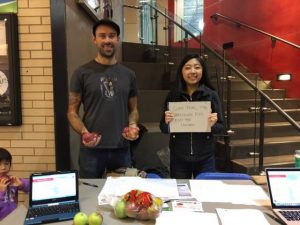
- Here is a picture of group members Ilan and Joy trialling the map in Hillcrest Centre in Riley Park:
Monday November 7th
- Trialling the Map at Community dinner at Little Mountain Neighbourhood House at 5pm.
- We will receive feedback about the map from the demographic that normally attend the neighbourhood house.
- We are trialling on two different days; a weekend and a weekday in order to gather feedback from a larger demographic and get a variety of responses
Wednesday November 9
- We plan to have contacted each asset at least once by phone. However, we expect data collection to continue until the project is completed.
Friday November 11
- We want to organize and compile all of the observations and data that was collected during the trialling sessions onto a google document
Week of November 14th-18th:
- Start working on final report
- We will use our proposal to help steer our final report in the right direction
- As we work on the final report, we will simultaneously develop our plan for our presentation
November 27th
- We will complete the info-graphic with all of the information regarding our project
- We will include an account of the changes in our knowledge, our skills, and our emotions
- By this point, we will have completed all data collection
November 30th
- Final Presentation day. Submit our final report through Turnitin
Moment of Significant Change Workshop
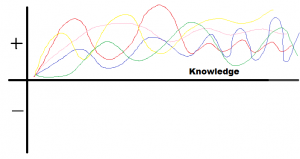
Below are our graphs that showcase each group member’s perception of their change in knowledge, skills, and emotion over the course of the project. The (+) represents positive and the (-) represents negative.
Explanation of knowledge:
Our knowledge dipped up and down throughout the course of the project because there were times when we thought we had clear expectations of what the project entailed but also had moments of confusion. Many things about the project were unclear and we had to figure out how to proceed and change our direction to make things work. At the beginning we had high hopes for the map and thought that it would be a great resource for the community and addressing food insecurity. But we realized as we learned new things that community partners mean well and has good intentions for the map but the actual usability of the map for the community isn’t as effective as expected. Which is why many times we had to backtrack and rethink how we wanted to proceed from square one again.
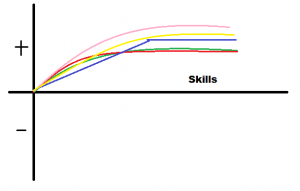
Explanation of Skills: We entered the project with skills that we have developed during past experiences which we assumed to be the zero point on the graph. As we began to work on the project, we developed data collection and communication skills and improved as the project went on. From sending emails to our community partners and the public health dietitians at Vancouver Coastal Health, we have learned to interact in a professional way with stakeholders. From speaking and questioning people on the phone, we have developed verbal communication skills. By inputting all the information collected onto the Excel documents, we have learned that organization is very important in data collection. We have been in communication and have been collecting data from the start of the project so we feel as though these skills have reached a plateau near the end of our data collection.
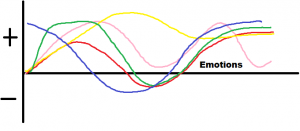
Explanation of Emotions: At the beginning of the project, many of us didn’t have expectations which is represented at the zero point of the graph. One person in our group had high expectations to begin with but decreased when given the task and resulted in confusion and uncertainty. As we learned more about the asset map initiative, we got more and more excited by the project and that we would be contributing to this resource to help with food insecurity in Vancouver. We experienced a dip in our emotions when we felt overwhelmed with all the documents that were given to us. Once we organized all the documents and created different folders, we felt more capable of tackling on the data collection. Our emotions increased again when we received replies from the assets.
Moment of Significant Change – Adapting to Changing Situations/Expectations
As a project unfolds, the scope is bound to change. Unexpected challenges arise and uncertainties present themselves. Reflecting on our own project, our group has experienced several of these challenges. Our mental conception of things did not coincide with the expectations the community partners had. Nonetheless, uncertainty has allowed us to ask more questions and be more diligent in the work that we do. The readings from the past weeks suggest that uncertainty is a way to promote more learning. “Without a certain amount of anxiety and risk, there’s a limit to how much learning occurs” (Shulman, 2005, p. 18).
Communication has been a core issue since beginning our project. Emailing food assets has resulted in slow or lack of reply. We understand people are busy however and turned to making phone calls. This poses its own challenges as some food assets such as churches do not have a regular person to answer calls. We also noted that when having conversations over the phone, it is important to remain cognizant that some terms such as “food asset”, “kitchen access”, and “food security” may not be clearly understand terms. It also became clear the importance of explaining what a food map is and its purpose.
We have experienced some difficulty in regards to our community partner. At first our community partner was not entirely aware of what was happening with trialling the map. This was clearly alleviated through communicating with Teya Stephans, our point of contact with Vancouver Coastal Health. There has also been some delay in arranging times and dates for the trialling. At times, waiting to hear back from our partner felt as though it slowed the momentum. Once again, Teya was instrumental in realigning us with our partner. A challenge that arose from this however was being asked very last minute opportunity to trial the map at a farmers market. Together as a group we remained flexible and have arranged dates that work for everyone.
Another concern that has presented itself pertains to the food assets themselves. We have been finding that some of them do not have any public kitchen access at all, or come at a very high cost. As a result, these assets are of little help to those facing food insecurity.
Finally, our perceptions of how useful the food asset map has changed since the beginning of the project. We believe the map to be a powerful tool for healthcare professionals and agencies but it is unclear how it will impact addressing overall food insecurity. We are hopeful that if there is consistent effort put into sustaining the map, keeping it updated, and adding new components, it can be a useful asset for the community.
Strategy for Successful Project Completion:
With the end of the term quickly approaching, our project has been in full swing. We have developed a group dynamic that allows us to communicate effectively and work efficiently. For the remainder of the term, we will finish up our individual data collection and then set up additional meetings to combine all our data collection into one cohesive document and analyze the data. After all our members go out to do our community map trialling, we will have completed most of our project and begin writing the final report and working on the presentation to showcase to our LFS 350 class. To successfully complete our project, we must get together during the last few weeks and bring all our ideas and learning experiences together into a final presentation and report and end off the term hopefully with a better idea of food security in our community. We hope that our involvement will make an impact on achieving food security in Vancouver.
References
Shulman, L. S. (2005). Pedagogies of uncertainty. Liberal Education, 91(2), 18–25. Retrieved from http://files.eric.ed.gov/fulltext/EJ697350.pdf