Tingyi’s Geob479 blog

Just another UBC Blogs site

Lab 3: Crime analysis using CrimeStat

In this lab we were introduced to conduct a Crime Analysis using GIS and CrimeStat.  We considered the spatial distribution of various crimes that occurred between January 2005 and March 2006, and examine how adjusting statistics for baseline population differences can make a large difference in the interpretation of the results.

Highlight: Some of the Maps created

Full Text Access: Lab3

Tutorial 3: Analyzing violent crime, workflow using ArcMap

I followed the instructions provided by ESRI here https://desktop.arcgis.com/zh-cn/analytics/case-studies/broken-bottles-2-arcmap-workflow.htm.

Full Text : GEOB479 Tutorial 3

HIghlights: Some of the Maps Created

Tutorial 2: Spatial Pattern Analysis: Exploring Dengue Fever

I followed the tutorial provided by ArcGIS (http://www.arcgis.com/home/item.html?id=49dde041c3634355bf073b0b55fa5b2d).

In the tutorial exercise, I used some spatial statistics tools (including Average Nearest Neighbour, Spatial Auto correlation, Calculate Distance Band from Neighbour Count, and Hot Spot Analysis) to better understand the pattern of Dengue Fever in Pennathur, a village in Southern India. This village is one of 44 villages that are part of a Dengue Fever study.

Highlight: Map created

Full text:Tutorial 2

Week 11: GIS and Crime

Police forces have been using GIS more and more often over the past 20 years–most larger Departments such as the Edmonton Police Service and the Ottawa Police Service would have at least performed an analyst using GIS. Using GIS to visualize crime occurrences is one of the most helpful usages of GIS in crime analysis. In general, maps are useful for understanding hierarchical perspectives and obtaining an overview of how things change.

Three ways in environmental criminology are introduced to understand the spatial distribution of crimes: Routine Activity Theory, Rational Choice Theory, and Criminal Pattern Theory.

Routine Activity Theory is described by the following formula: likely offender + suitable target – capable guardian = crime opportunity

Rational Choice Theory assumes that offenders make a rational decision about whether to commit a crime. The theory supposes that criminals will balance rewards against the chances of getting caught.

Criminal Pattern Theory states that offenders will be affected by the routines of their daily lives. For example, they will commit crimes in areas they are familiar with.

GIS is a valuable tool that virtualizes the pattern of crimes by identifying problem areas, producing maps for officers to use in the field, keep track of particular offenders, and assist in solving crimes, and then we would we could model and even predict crime.

Week 8: GIS and Health Geography

Spatial data is of great concern to population health studies. People and entities do not exist in a vacuum, and as such are influenced by and influence those around them. This can lead to geographically correlated issues where space and place are of huge importance, hence the need for GIS in health studies.Spatial epidemiology provides a framework to examine the influences of space and place on
health. Space and place can often be used as surrogates for influences on health

Major application for GIS includes the following four:

1. Spatial epidemiology
2. Environmental hazards
3. Modeling Health Services
4. Identifying health inequalities

The use of GIS in health geography also comes with some limitations. One key issue is that of data. Flawed data leads to flawed analyses. Also, people are extremely dynamic, and it is difficult to take all the possible variables into account.

Major issues: Spatial Misalignment; Uncertainty; Best Plactices…

Week 6 : What is health geography?

Health geography is related to medical geography, but is much more. It should be obvious that GIS can play a major role in several areas of health geography. However, similarly, it should also be obvious that the use of technologies such as GIS must always be tempered by a critical social and cultural perspective on the issue. The three main themes in the geography of health care (or medical geography) are : disease ecology, health care delivery, and environment and health. Health geography problematizes some of the unquestioned beliefs of medical geography. This includes the assumption that doctors are “neutral,” and that factors such as gender and race are important to the provision of healthcare for various populations. Different populations are treated differently and view the system differently.


Method Introduction – Geographically-Weighted Regression


Geographically weighted regression (GWR) is a spatial analysis technique widely used in geography and related disciplines related to spatial pattern analysis. GWR explores spatial changes and related drivers at a certain scale by establishing local regression equations at each point in the spatial range and can be used to predict future results. As it takes into account the local effects of spatial objects, its advantage is the higher accuracy. It detects the non-smoothness of spatial relations by embedding spatial structures into linear regression models. Because the method is not only simple and easy, the estimation results have a clear analytical representation, and the resulting parameter estimate can also be statistically tested, so more and more research and application.

In the spatial analysis, observational data is generally sampled as sampling units according to a given geographic location, and as the geographical location changes, the relationship or structure of the variables changes, i.e. the “space non-smoothness” referred to in GIS. This spatial non-stability is commonly found in spatial data, such as the incidence of AIDS in different provinces, the TN content of different depths of lakes, pm2.5 concentrations in urban and non-industrial areas, etc. If the traditional linear regression model is used to analyze spatial data, it is generally difficult to obtain satisfactory results, because the global model assumes that the relationship between variables is “anionic” before analysis, and the result is only some “average” in the study area. Therefore, it is necessary to adopt a new local regression method to deal with the nature of spatial data itself. Geographically weighted regression extends the traditional regression framework by allowing taking non-stationary variables into consideration (e.g., climate; demographic factors; physical environment characteristics) and models the local relationships between these predictors and an outcome of interest. In other words, GWR runs a regression for each location, instead of a sole regression for the entire study area. It is applied under the assumption that the strength and direction of the relationship between a dependent variable and its predictors may be modified by contextual factors. GWR has high utility in epidemiology, particularly for infectious disease research and evaluations of health policies or programs. The GWR model is proposed by researchers and has been practiced and verified extensively.

Limitations of GWR include problems of multicollinearity (the local regression coefficients are potentially collinear even if the underlying exogenous variables in the data generating process are uncorrelated) and the approaches to calculating goodness of fit statistics. Results and Discussion

I missed the presentations on Landscape Ecology due to illness, please see my review paper from the link under the page title

Lab 2: Introduction to Geographically Weighted Regression.

Report Title : 

An Analysis of the Relationship between Children’s Language Skills and Early Development Level of the Children and Their Neighborhood using Geographically-Weighted Regression.

Abstract


This research analysis how children’s language skills level related to their and their neighbourhoods’ development level based on the Vancouver area. In order to understand their spatial correlation properties, the GWR (geographically-weighted regression) is used for modelling. The results indicate that GWR can provide relatively accurate results of local relations amongst a set of variable for spatially examining the data spatially with the use of ArcGIS software. Also, how a child’s language skills related to some important Early Development Instrument (a small set of variables related to that child and to their neighbourhood) explored in this lab can be helpful in understanding the neighbourhood development and distribution pattern of the development conditions.

Full text access: lab 2 REPORT

Highlight:

Further Discussion on different Usage of GWR


The Geographically weighted Regression method is also broadly used in many researches associated with spatial analysis. For instance, GWR can be used for modelling in  soil chemical content or physical charachteristics pattern. A research doneby Zhang, Tang, Xu, and Kiely in 2011 use a geographically weighted regression (GWR) method for the spatial modelling of soil organic carbon contents in Ireland. The scientists included environmental factors of rainfall, land cover and soil type were investigated as the independent variables to establish the GWR model. They used GWR to create comparable and reasonable results while making use of  the other chosen methods of ordinary kriging (OK), inverse distance weighted (IDW) and multiple linear regression (MLR). In this research, patial geochemical modelling was achieved using geographically weighted regression (GWR) as a basic step. The GWR also provided a promising method for spatial geochemical modelling of SOC and potentially other geochemical parameters.

GWR is also seen used in more social scientce sccociated research. An simple and typical example can be a case study based on a small town called Menghe in Changzhou, China(2010). The scientists did simulation on regional spatial sand sse patterns using Geographically Weighted Regression. The spatial non-stationary of the impact on the land use patterns change of the driving factors was considered.The simulation result was compared with OLS Logistic regression model. Geographically Weighted Regression model is not only able to improve simulation accuracy of regional land-use patterns,but also able to obtain spatial differentiation of the impact of the driving factors on land use patterns.The result of this study can support the government decisions on land use management for Menghe Town and similar areas.

GWR has good potential in helping studies associated with landscape, geochemistry and other phisical or chemical properties of the environment of an area (not only the propertoes on the ground, but also suitable in analysis the pattern of the properties of water; air weather, etc.).And then, researches in many fields (both in social and natural science) that needs spatial analysis especially which require higher accuracy probabaly need including GWR in the data analysis process in researches.

Tutorial 1: Spatial Statistics using ModelBuilder

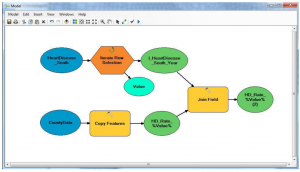
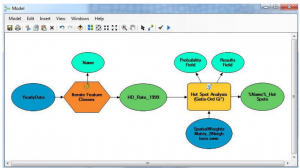
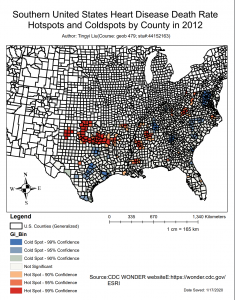
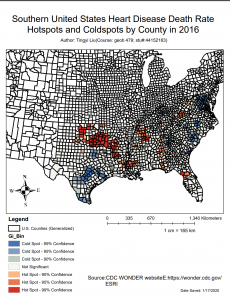
In this tutorial exercise, we used CDC Wonder Data and Model Builder to create yearly hot spot
maps of Heart Disease. I brought the data into an ArcGIS file geodatabase, then
create a model to process the data into individual feature classes

, one for each year and
a second model to perform hot spot analysis on each year’s feature class. Finaly we animate the
yearly hot spot feature class maps.

Spam prevention powered by Akismet