
To determine the risk of slope failure due to earthquakes I used the Probabilistic Seismic Analysis Method developed by Jibson, Harp, and Michael (2000). This model was calibrated in Oat Mountain, California, using ground movements recorded during the Northridge Earthquake. It follows the model displayed in Figure 3: Probabilistic Seismic Analysis Workflow.
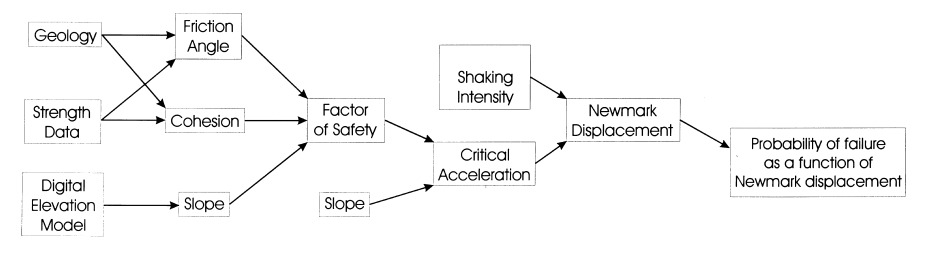
Figure 3: Probabilistic Seismic Analysis Workflow (Jibson, Harp, Michael)
- Factor of Safety
- Critical Acceleration
- Shaking Intensity
- Newmark Displacement
- Probability Layer
The Factor of Safety was determined using the Formula [1], where c’ is the effective cohesion, γ is the unit weight of the soil, t is the thickness of the slab which was assumed to be 2m based off the average slab properties of this region, α is the slope angle, φ’ is the effective friction angle of the soil, and m is the percent saturation of the slope, which I assumed to be zero to simplify the analysis.
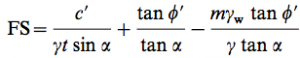 [1]
[1]
Using the Raster Calculator, I first converted the Friction Angle layer into radians from degrees, then created a new Factor of Safety layer based off Formula [1].
Critical acceleration was determined with the Raster Calculator using Formula [2].
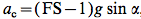 [2]
[2]
Then, as ac must be greater than 0 to calculate the Newmark Displacement, we reclassified every cell with a value equal to or less than 0 with a value of 0.00001.
The shaking intensity, otherwise know as Arias Intensity (Ia), was arrived at using Jibson’s (1993) method as shown in Formula [3]. T is the duration (Dobry duration) while â is the Peak Ground Acceleration (PGA) in g’s. The Dobry duration is calculated using the relationship displayed in Formula [4], where M is the unspecified earthquake magnitude.
 [3]
[3]
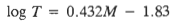 [4]
[4]
The PGA was calculated using Campbell’s (1981) empirical relationship (Formulas [5] and [6]) between the earthquake magnitude and closest distance away from the causative fault, which was assumed to be the Juan de Fuca plate 300km west of Squamish. R is the closest distance to the causative fault and M is the earthquake magnitude.
â = 0.0159Exp(0.868M)/[R+C(M)]1.09 [5]
C(M) = 0.0606Exp(0.7M) [6]
We then found Ia for different earthquake magnitudes as displayed in Table 2 below.
Table 2: Ia for Earthquake Magnitudes
| M | Ia |
|---|---|
| 6.0 | 0.00017 |
| 6.5 | 0.00066 |
| 7.0 | 0.0025 |
| 7.5 | 0.0097 |
| 8.0 | 0.037 |
| 8.5 | 0.137 |
Using Raster Calculator I then created a raster layer of the Newmark Displacement (Dn) using Formula [7] below. I created different layers for the different Ia values.
 [7]
[7]
From the Newark Displacement layer I generated a probability layer using the empirical formula [8] developed Jibson, Harp, and Michael.
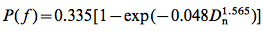 [8]
[8]
Upon generating the different layers for each of the Earthquake magnitudes listed above, there were no distinct changes in probability from Figure 4: Probability of Displacement in a 8.5M Earthquake displayed below. From this we can reach the conclusion that the probability of displacement is directly related to the ground properties and that the ground movement is not significant enough to cause a greater probability of displacement.
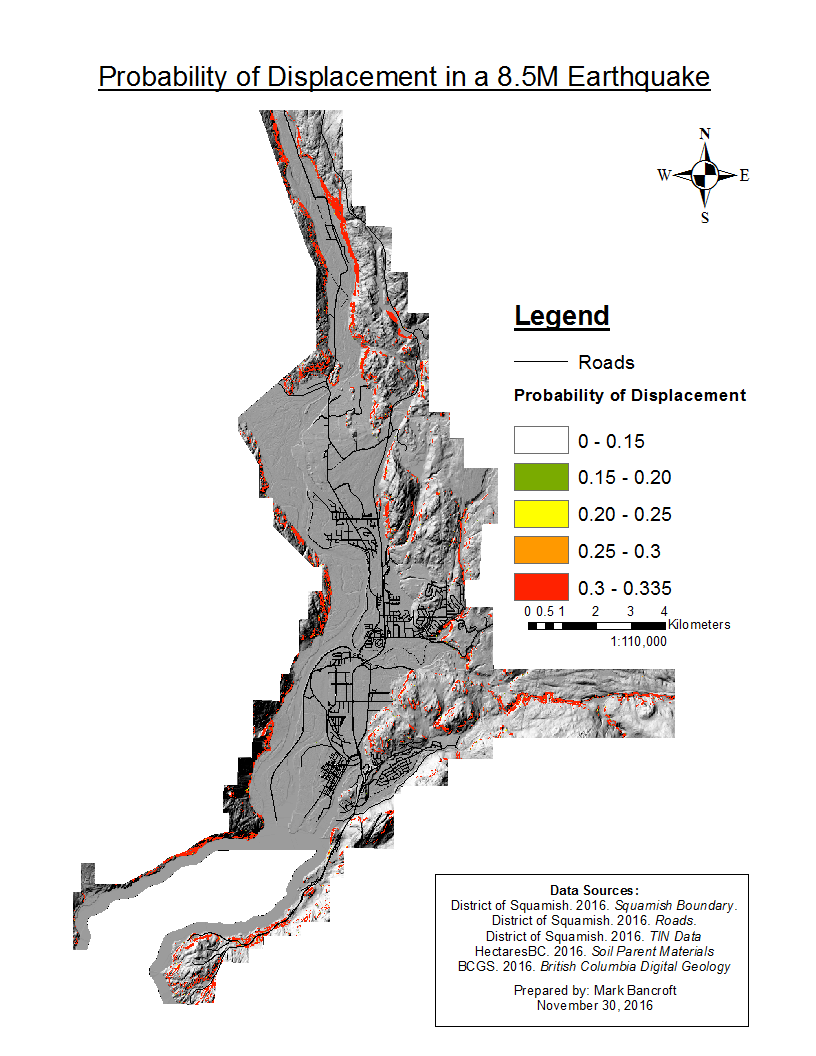
Figure 4: Probability of Displacement in a 8.5M Earthquake